


The Galileo Energetic Particles Detector
Galileo EPD Handbook
Chapter 1. Instrument Summary
Electronic Inflight Calibration
Source: D.E. Fort, SDO/PAO-0040, January 20-21,1981
Figure 1-32 shows a simplified block diagram of the closed loop threshold calibrator and how it interfaces with the rest of the EPD electronics. The chopper chops the DC output from the integrator to create a signal that can be amplified by the amplifiers at the outputs of the particle detector.
The 1 of N discriminator select circuit feeds the outputs of the pulse height discriminator to the input of the calibrator. A sample and hold circuit and an integrator create a DC level that is input to the chopper. Figure 1-33 shows a detailed block diagram of the portion of the diagram in Figure 1-32 that is enclosed in a dotted line. The ramp generator produces a slowly increasing DC voltage level which is chopped by the fast chopper at a 900 Hz clock rate to produce a train of pulses with increasing amplitudes (see Figure 1-34). These pulses are then shaped and attenuated appropriately for output to the CMS and LEMMS channels.
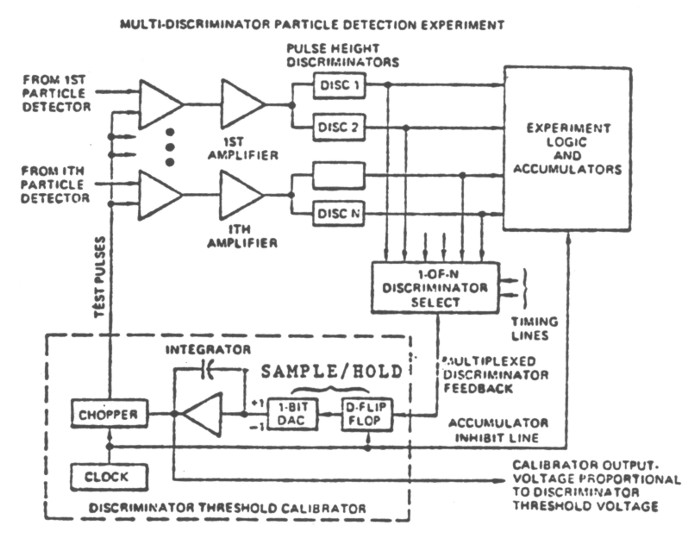 |
Figure 1-32. Block diagram of the basic closed loop threshold calibrator. |
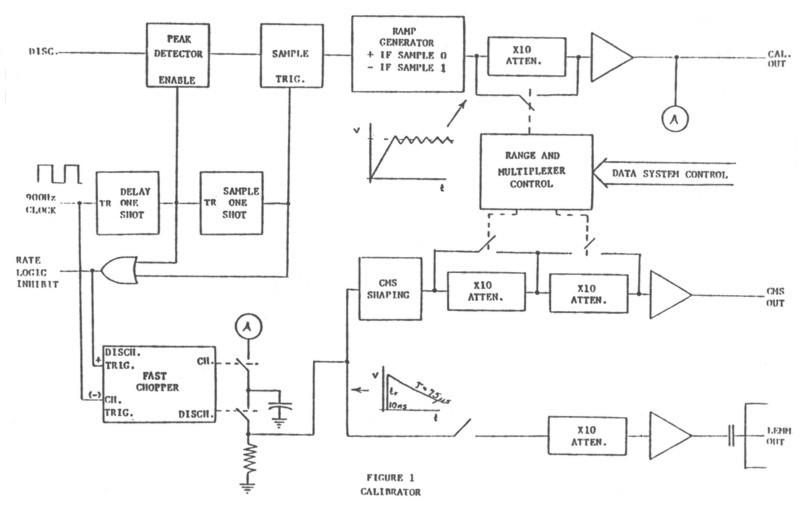 |
Figure 1-33. Calibrator block diagram. |
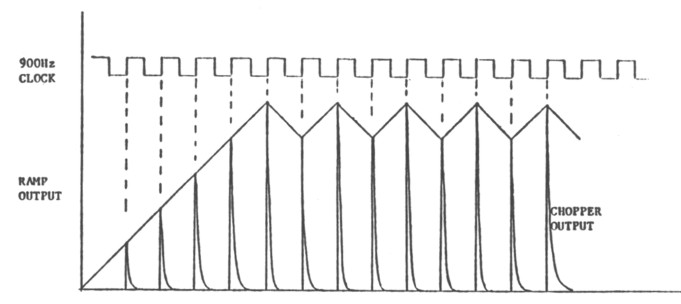 |
Figure 1-34. 50% discriminator firing. |
When a particular channel is to be calibrated, the appropriate discriminator is selected by a multiplexer and fed back to the discriminator input of the calibrator. (Figure 1-35 illustrates the feedback path in more detail.) When the pulse amplitudes exceed the discriminator threshold, fixed-amplitude discriminator pulses appear on the feedback line, and are gated through to a holding capacitor by an enable pulse. The enable pulse has been designed to open for a short time (~5 micro s) corresponding to the expected range of arrival times for a chopper-induced discriminator pulse. The holding capacitor compensates for amplitude dependent time delays by holding each sample long enough for it to be clocked into a D flip-flop at the trailing edge of the gate enable pulse. The output of the D flip-flop controls the ramp generator which consists of an op-amp integrator referenced to VREF. If a sample is 0 (no discriminator pulse), the integrator generates a positive ramp and the chopped pulse amplitudes increase until a discriminator pulse results (sample = 1). The ramp then becomes negative until the samples once again become 0. The process then repeats.
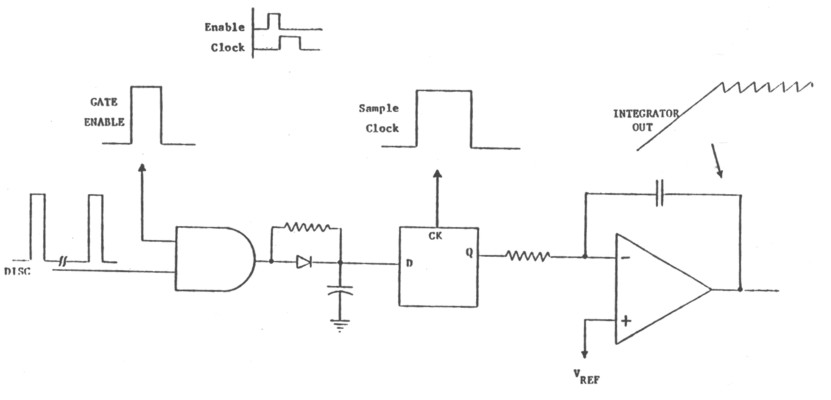 |
Figure 1-35. Calibrator feedback detail. |
Since the flip-flop is CMOS, assume Q swings between ground and the supply voltage VS. If VREF is then set to 1/2 VS, the positive and negative ramps will have equal slopes. More important, however, is the fact that in the steady state condition, the average value of Q must also be 1/2 VS to balance the inputs to the op-amp. Since Q is updated and held once each clock cycle (900 Hz), this corresponds to an average discriminator rate of 450 Hz or, in other words, 50 percent discriminator firings.
Suppose VREF is set to 0.12 VS. Now the average value of Q must be .12 VS in the steady state, corresponding to an average discriminator rate of 108 Hz or 12 percent discriminator firings. In the absence of channel noise, the only "noise" is the ripple on the integrator output as it ramps up and down about the discriminator threshold. In this case, one expects the average value of this waveform to stabilize below the absolute value of the discriminator threshold until the peaks of the ripple cause the discriminator to fire 12 percent of the time (see Figure 1-36). As channel noise is added, this average value will decrease as it tracks the 12 percent point on the Gaussian curve.
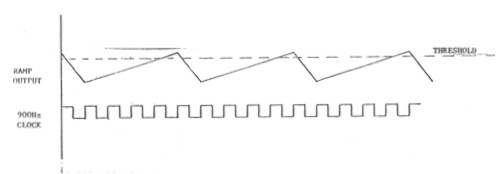 |
Figure 1-36. Low percentage discriminator firings. |
Suppose VREF is set to .88 VS, corresponding to 88 percent discriminator firings. The arguments in the above paragraph lead to the conclusion that the output now stabilizes above threshold in the absence of channel noise, and it now tracks the 88 percent point on the Gaussian curve.
If the difference between the 12 percent and 88 percent readings is taken under low noise conditions, the amount of contribution due to the ripple can be measured. If this is then subtracted from the overall reading on a noisy channel, a direct indication of the noise is obtained.
This description just outlines the basic concepts involved in noise measurement by the inflight calibrator. No attempt has been made to include the second order effects of temperature, non-linearity, imperfect averaging, or quantization errors in the A/D converter which measures the integrator output.
The calibrator system will be turned off except during calibrations. Each of the lines is clamped to ground through ten ohms when the calibrator is off to prevent cross-talk between channels.
Next: Flight Study of CMS/TOF Event Calibrations
Return to the CMS Subsystem Index
Return to Galileo EPD Handbook Table of Contents Page.
Return to main
Galileo Table of Contents Page.
Return to Fundamental
Technologies Home Page.
Updated 8/23/19, Cameron Crane
QUICK FACTS
Mission Duration: Galileo was planned to have a mission duration of around 8 years, but was kept in operation for 13 years, 11 months, and 3 days, until it was destroyed in a controlled impact with Jupiter on September 21, 2003.
Destination: Galileo's destination was Jupiter and its moons, which it orbitted for 7 years, 9 months, and 13 days.