


The Galileo Energetic Particles Detector
Galileo EPD Handbook
Chapter 1. Instrument Summary
LEMMS Subsystem Overview
Source: The Galileo Energetic Particles Detector, D. J. Williams et al., Space Science Reviews, 60, 383, 1992 (excerpts).
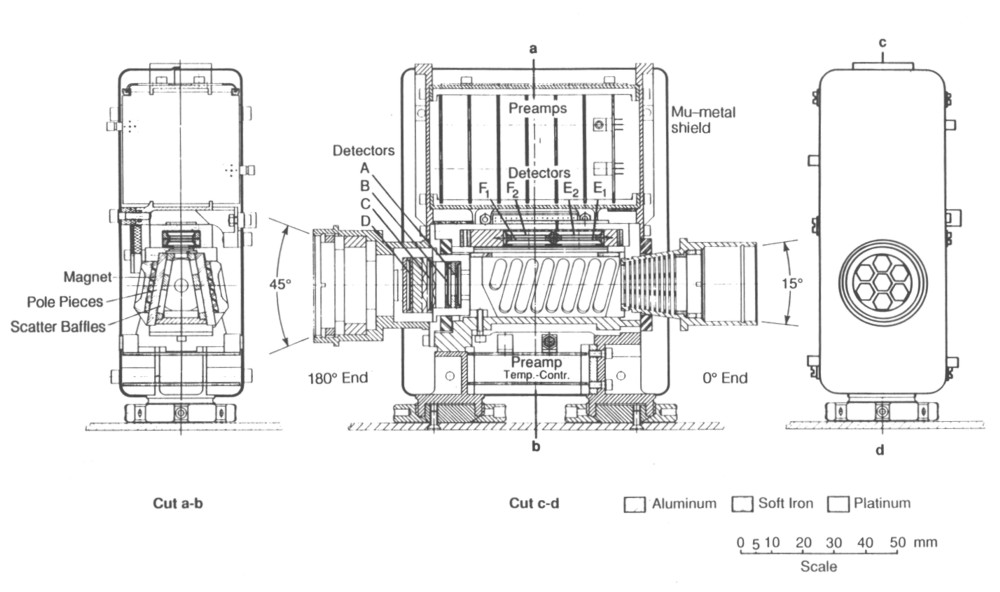
The LEMMS detector head, shown in Figure 1-48, is a double-ended telescope containing eight heavily shielded silicon solid state surface barrier totally depleted detectors providing measurements of electrons from 15 keV to >11 MeV, and ions from 22 keV to ~55 MeV, in 32 rate channels. The LEMMS design uses a baffled collimator and shaped-field magnetic deflection to provide clean separation between ions and electrons in detectors A, E, and F (0° end) and extends measurements to much higher energies via detectors C and D in the oppositely-directed double-absorber-detector telescope stack on the 180° end.
Figure 1-48. Detail of the EPD LEMMS detector head.
Source: W. Studemann, SDO/PAO, Jan. 20-21, 1981
Table 22 gives a summary of the detector specifications for LEMMS.
TABLE 22. EPD Galileo-LEMMS -
Summary of Detector Specs.
Measurements Before and After Sensor-Integration (EM), Aug.
25, 1980
| Dat. Code | Det. No. | Active Area (mm2) | Dept. Layer (μm) | Oper. Bias UB(V) | Leakage Current at UB (μA) | Det. Noise (keV) | Detectors are Integrated in Sensor Leak. Curr. Noise | Det. and Preamps Integrated **Noise (keV) | |
| μA | keV | ||||||||
| A | 3194 | 11.3 | 100 | 60 | 0.10 | 6.6 | 0.16 | 7.3 | Oscil. |
| B | 3120 | 36 | 983 | 250 | 0.83 | 12.0 | 1.0* | 50* | 11.2 |
| C*** | 3224 | 87 | 500 | 250 | 1.05 | 15.1 | 1.16 | 15 | 13.3 |
| D | 3225 | 95 | 500 | 250 | 0.47 | 9.1 | 0.34 | 9 | 13.2 |
| E1 | 3142 | 45 | 305 | 60 | 0.39 | 7.2 | 0.34 | 7.4 | 9.9 |
| E2 | 3141 | 45 | 303 | 60 | 0.40 | 7.5 | 0.44 | 8.3 | 13.3 |
| F1 | 3163 | 45 | 1098 | 250 | 1.16 | 14.3 | 0.85 | 13.5 | 11.6 |
| F2 | 3138 | 45 | 303 | 60 | 0.38 | 9.6 | 0.45 | 11.5 | 13.7 |
* Det. breakthrough at Vb=200V
** Noises have been measured with main-pulse amplifier (bipolar) shaping - time=1 msec for all channels.
***Unstable noise
The LEMMS channel descriptions in Table 23 come from the July 20, 1979, memo describing the EPD telemetry format, and they have not changed. For 2/3 of a second every 4-2/3 seconds the EPD PHA is devoted to LEMMS, taking spectra from Detectors A, E1 and F1 in the sequence (and over the energy range) given at the bottom of Table 23.
Data accumulated over 2/3 second is then read out over 4-2/3 seconds, and events are then accumulated again. One spectrum every 4-2/3 seconds is slightly more than 4 spectra per spin, so very good anisotropy measurements should be possible as a function of energy. The LEMMS PHA data complements the LEMMS rate channels. Because both sets of data are accumulated in the same 2/3 sec. interval, the LEMMS PHA measurements can be exactly normalized against the LEMMS rate channels. (See Table 1.) The rate channel readout interval indicates the amount of time that data is accumulated before the accumulator is read out and reset. The sum of 11 LEMMS PHA spectra from Detector A, then one from E1 and one from F1, takes 13 x 4-2/3 = 60-2/3 sec. Thus one full LEMMS PHA cycle takes one spacecraft major frame. Significant spectra will be taken over most of the Jovian magnetosphere inside of 70 to 90 RJ.
TABLE 23. LEMMS Channel Descriptions
| Channel Name |
Species |
Energy Range |
Readout Intervalb (in 1/3 s) |
Logic |
| A0 | Z ≥ 1 | 0.022-0.042 | 1 | A1 (A2 B1) |
| A1 | Z ≥ 1 | 0.042-0.065 | 1 | A2 (A3 B1) |
| A2 | Z ≥ 1 | 0.065-0.120 | 2 | A3 (A4 B1) |
| A3 | Z ≥ 1 | 0.120-0.280 | 2 | A4 (A5 B1) |
| A4 | Z ≥ 1 | 0.280-0.515 | 2 | A5 (A6 B1) |
| A5 | Z ≥ 1 | 0.515-0.825 | 2 | A6 (A7 B1) |
| A6 | Z ≥ 1 | 0.825-1.68 | 2 | A7 (A8 B1) |
| A7 | Z ≥ 1 | 1.68-3.20 | 2 | A8 (A9 B1) |
| A8 | Z ≥ 2 | 3.50-12.4 | 4 | A9 (B1 C2) |
| B0 | Z = 1 | 3.20-10.1 | 4 | A7 B1 (C2) |
| B1 | electrons | ~1.5-10.5 | 4 | A2 (A4) B1 (B2 C2) |
| B2 | Z = 2 | 16.0-100 | 4 | A8 B3 (C2) |
| DC0 | Z ≥ 2 | 14.5-33.5 | 4 | (B1) D2 (C1) |
| DC1 | Z ≥ 2 | 51-59 | 4 | (B1) C2 D1 |
| DC2 | electrons | >~2 | 4 | (B1) D1* (D2) |
| DC3 | electrons | >~11 | 4 | (B1) C1 (C2) D1 |
| E0 | electrons | 0.015-0.029 | 1 | E11 (E12 E2) |
| E1 | electrons | 0.029-0.042 | 1 | E12 (E13 E2) |
| E2 | electrons | 0.042-0.055 | 2 | E13 (E14 E2) |
| E3 | electrons | 0.055-0.093 | 2 | E14 (E15 E2) |
| F0a | electrons | 0.093-0.188 | 2 | E15 (E16 E2); F11 (F12 F2) |
| F1 | electrons | 0.174-0.304 | 2 | F12 (F13 F2) |
| F2 | electrons | 0.304-0.527 | 2 | F13 (F14 F2) |
| F3 | electrons | 0.527-0.884 | 2 | F14 (F15 F2) |
| AS | singles | all counts in detector | 8 | A1 |
| BS | singles | all counts in detector | 4 | B1 |
| CS | singles | all counts in detector | 4 | C1 |
| DS | singles | all counts in detector | 4 | D1 |
| EB1 | background | sidewise penetrators | 4 | E16 (E2) |
| EB2 | background | E1E2 coincidences | 4 | E11 E2 |
| FB1 | background | sidewise penetrators | 4 | F15 (F2) |
| FB2 | background | F1F2 coincidences | 4 | F11 F2 |
*D1 per telecon McEntire,
4/12/94
a Channel F0 is the sum of
~100-200 keV events seen in detectors E1 and F1.
b At nominal 3 RPM: 1/3 s = 60 readouts/spin,
6° 'sectors'; 2/3 s = 30 readouts/spin, 12° 'sectors';
4/3 s = 15 readouts/spin, 24° 'sectors.'
LEMMS PHA is
accumulated for 2/3 s every 4.66s. There are 46 linear
channels and 1 high-energy channel.
Sequence is: 11 spectra from Det. A (20-290 at 6.4
keV/ch); 1 spectra from Det. E1 (15-190 keV at 4.5 keV/ch);
1 spectra from Det. F1 (80-890 keV at 20.1 keV/ch).
This sequence is 60 2/3 s long, and repeats.
The magnetic field which separates the electrons from the ions in the LEMMS is in the direction shown in Figure 1-3. The pole pieces are tilted toward each other at a small angle to establish a field gradient that will focus electrons with energies between 15 keV and 1 MeV on the E1 and F1 electron detectors in the short length of the telescope.
The honeycomb aperture keeps high energy electrons and ions from impacting E1 and F1 directly.
The total weight of the LEMMS system, including detectors, magnets, and preamplifier, is about 908 grams. The LEMMS electronics consumes about 350 mW.
The electron detectors are rectangular, while all of the other detectors are circular. There are no notable problems with the preamp baseline restorer on A. However, there is a problem with pulse ringing that seems to arise from the layout of the boards. The pulse amplifying electronics are contained on three boards. These boards contain all of the main amplifiers, baseline restorers and discriminators for the LEMMS detectors. Board II amplifies the unipolar pulse from channels A and E. Board III amplifies bipolar pulses from channels C, D, and E2.
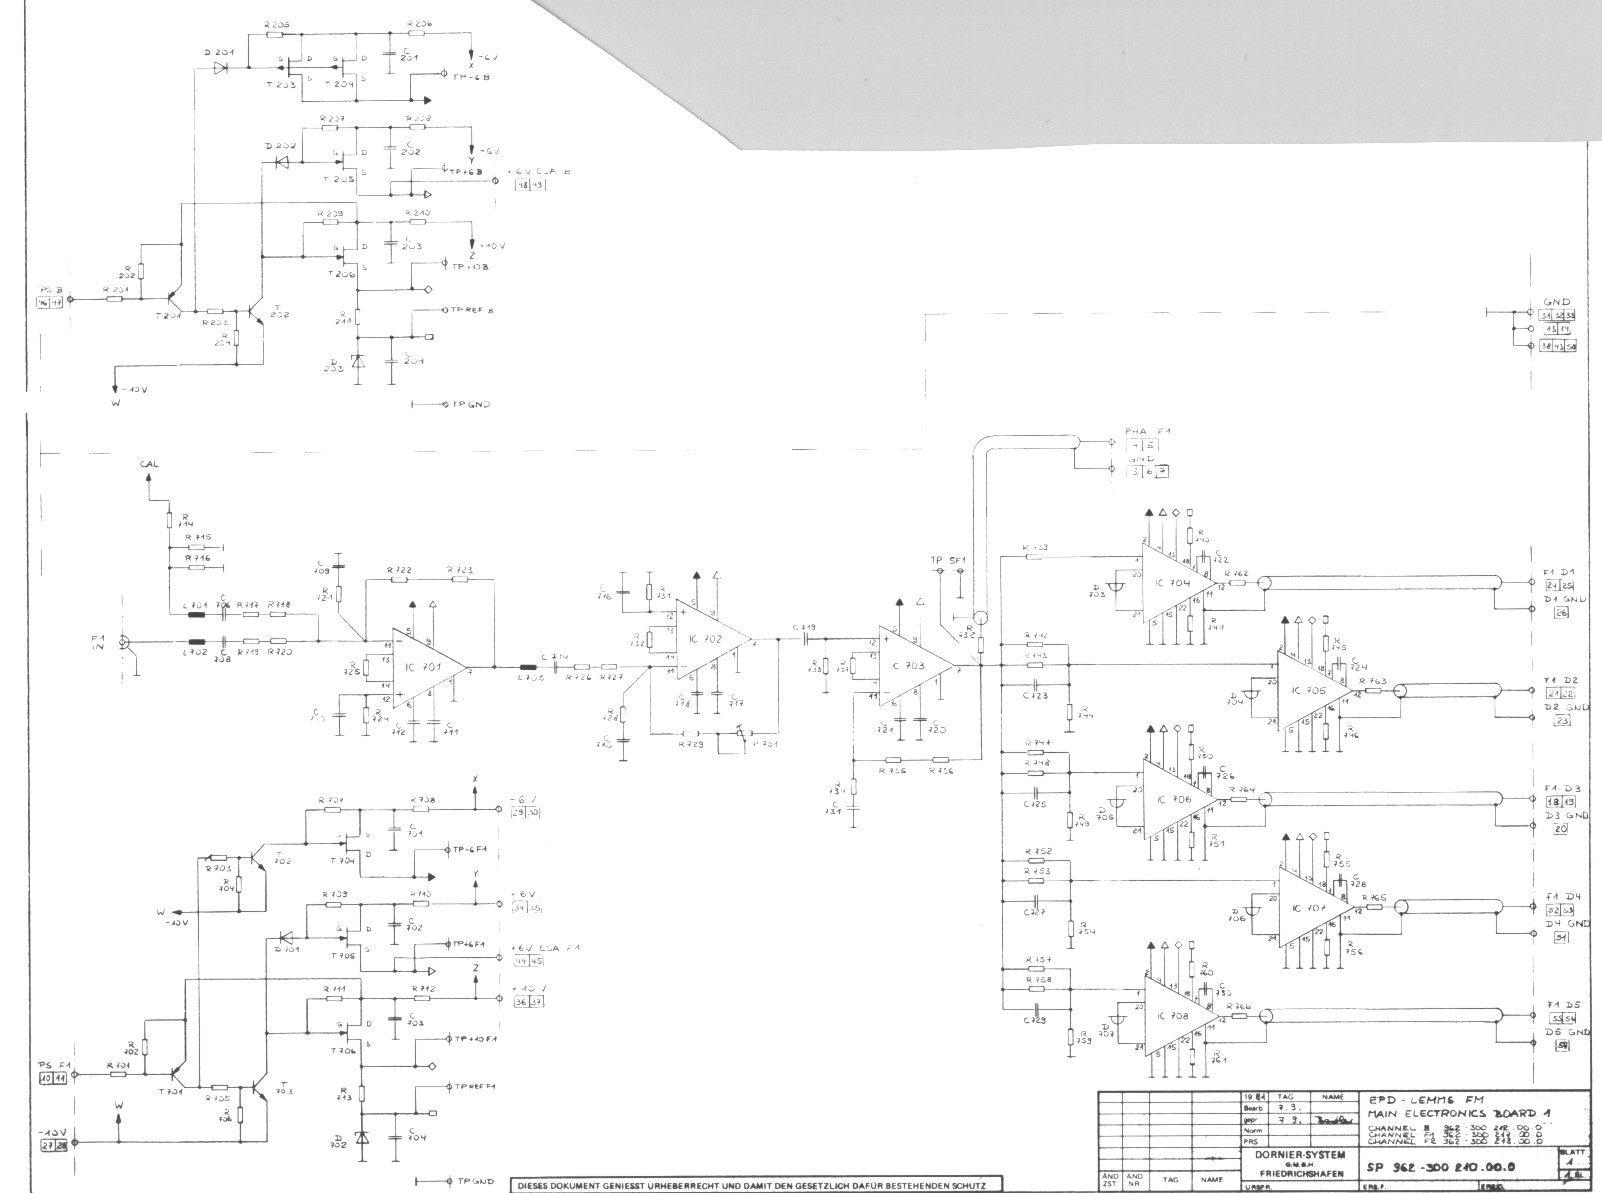
Figure 1-49 shows a schematic of Board I. There are three inputs, one for each detector output (F2, B and F1). All channels are bipolar. There is only one F2 discriminator, since F2 acts only as an anti-coincidence detector for electrons. However, there are 3 discriminator outputs for Detector B and 4 for Detector F1. F1 also has an output which goes directly to the PHA for more detailed analysis. At infrequent intervals there will be a full spectrum at a higher resolution on the electron detectors.
Figure 1-49. Overview - schematic of Board I.
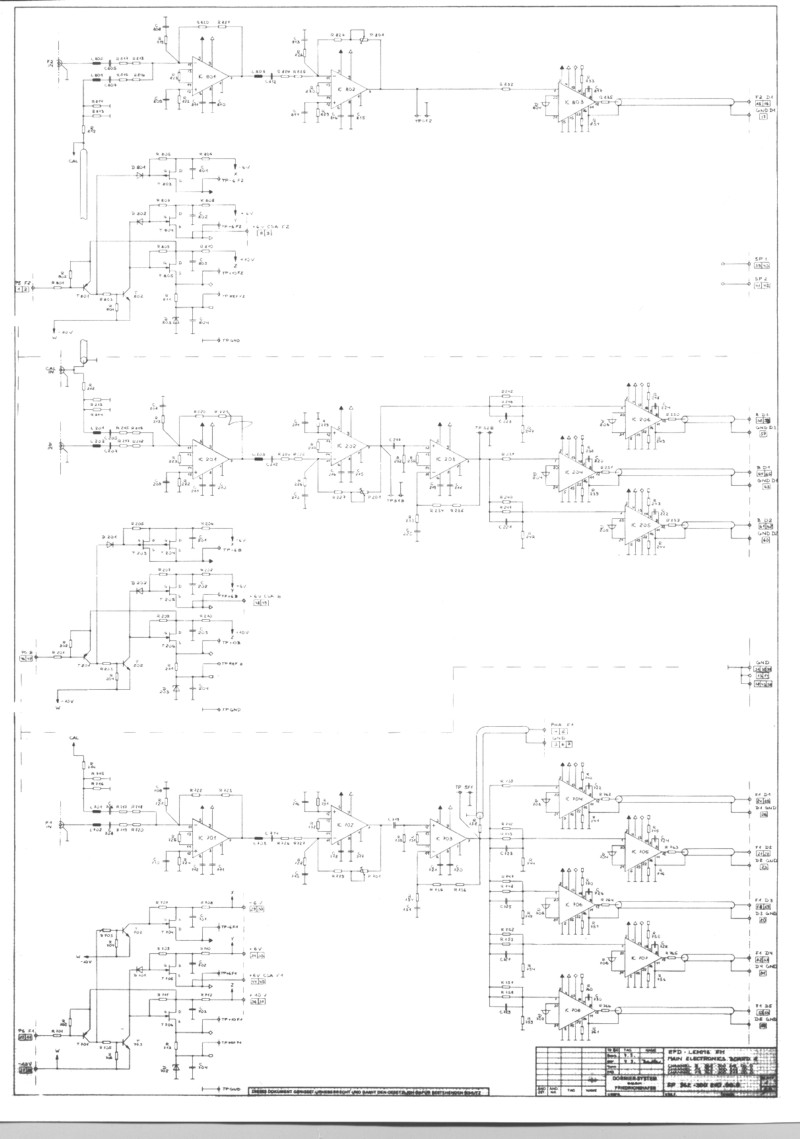
Figure 1-49 - Larger view of top half
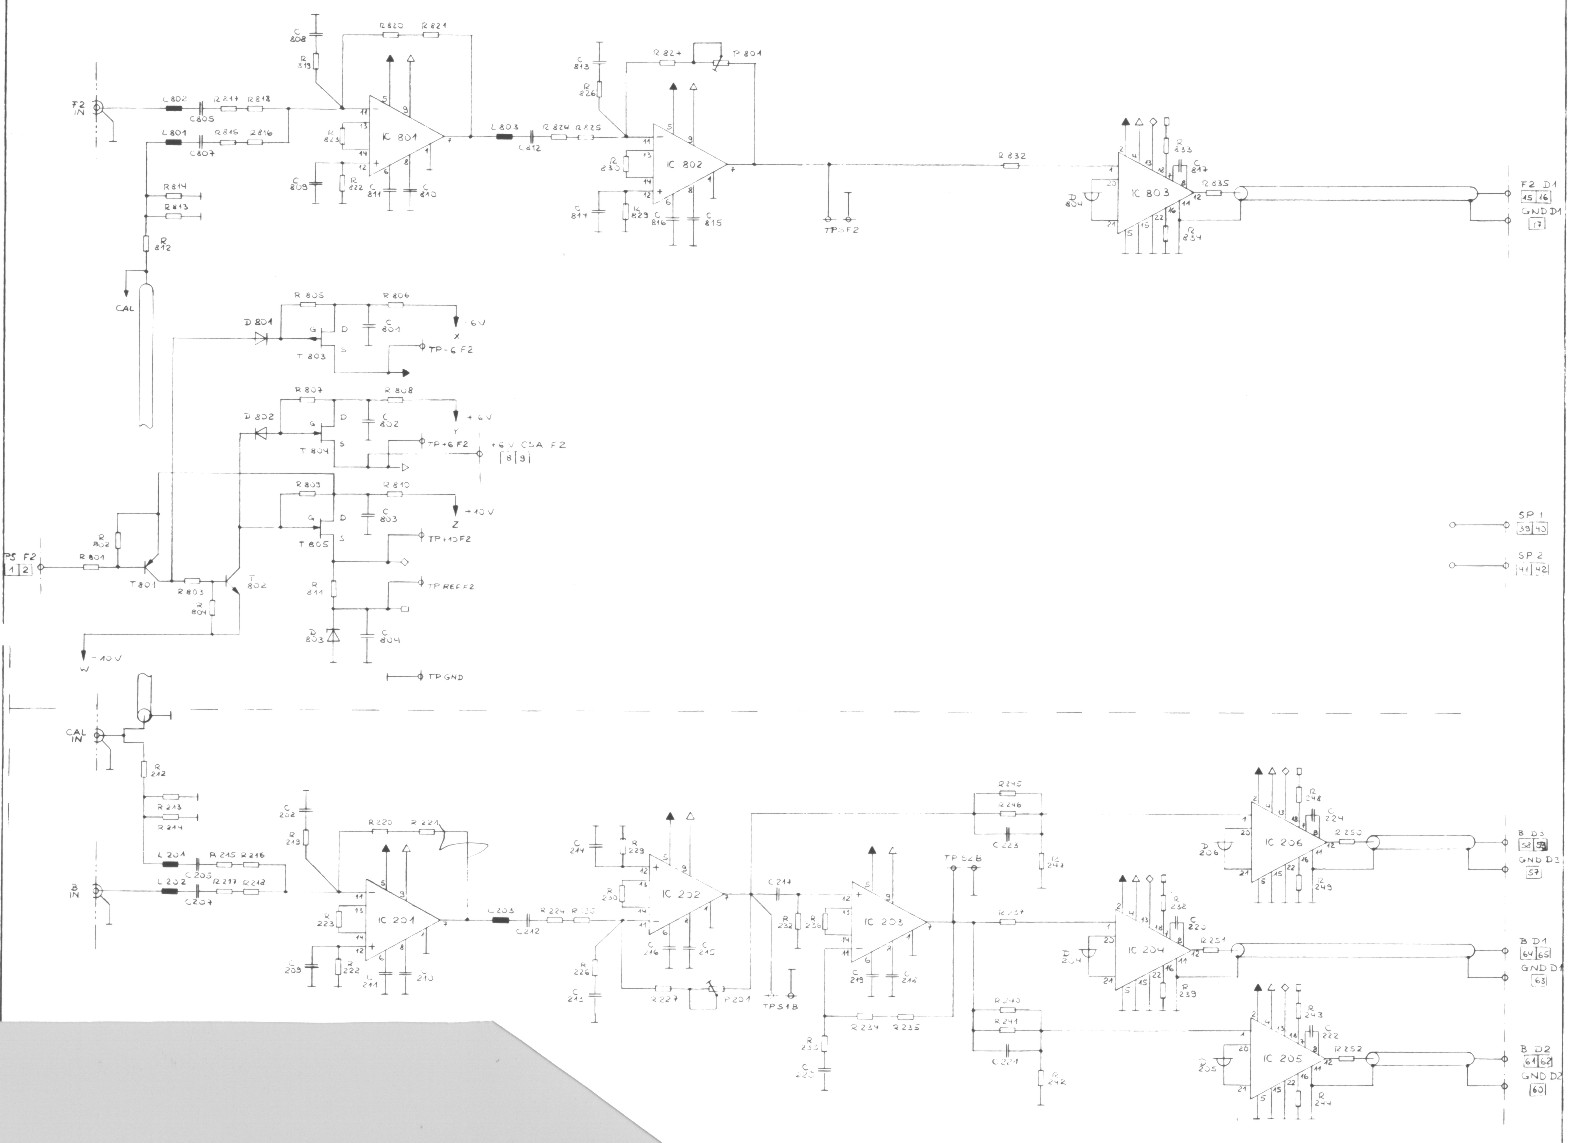
Figure 1-49 - Larger view of bottom half
Return to Galileo EPD Handbook Table of Contents Page.
Return to main
Galileo Table of Contents Page.
Return to Fundamental
Technologies Home Page.
Updated 8/23/19, Cameron Crane
QUICK FACTS
Mission Duration: Galileo was planned to have a mission duration of around 8 years, but was kept in operation for 13 years, 11 months, and 3 days, until it was destroyed in a controlled impact with Jupiter on September 21, 2003.
Destination: Galileo's destination was Jupiter and its moons, which it orbitted for 7 years, 9 months, and 13 days.