


Investigation of the Magnetosphere of Ganymede with Galileo's Energetic Particle Detector
Ph.D. dissertation by Shawn M. Stone, University of Kansas,
1999.
Copyright 1999 by Shawn M. Stone. Used with permission.
6.4.2 Feature G2-19:10:51
This feature is a loss cone feature. The results for one shot mode are shown for models M1 and M2 in Figures 6.125 through 6.128 for energy channels E3 and A4. Model M1 does not pick up the feature at all for A4 channel and only a little for channel E3. Model M2 seems to catch the feature in time and in depth quite well for both the ions and electrons. However, it can be seen from Figure 6.126 that the width of the actual feature is wider than the simulated. The reason for the missed feature for model M1 can be investigated by a detailed time-reversed trace of one of the sublook directions in the data point indicated by an arrow in Figure 6.127.
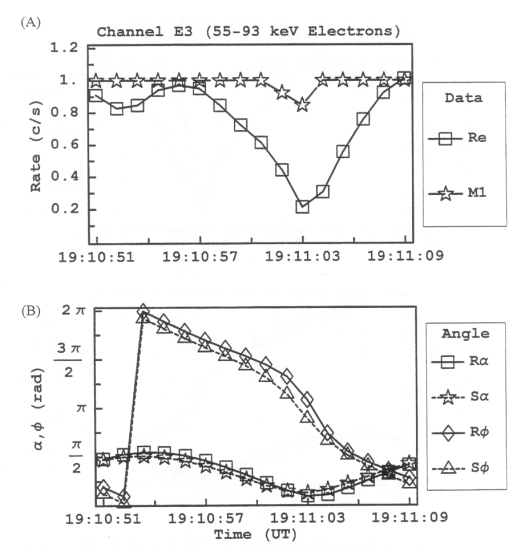 |
Figure 6.125 (A) Rate profile for feature G2-19:10:51 for channel E3 model M1 compared to real data (Re). (B) The pitch (a) and phase (f) values of the particles as measured by the EPD detector relative to the real R and simulated S field. |
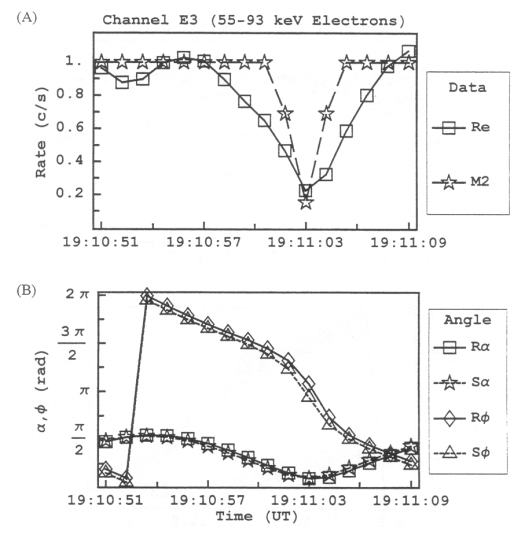 |
Figure 6.126 (A) Rate profile for feature G2-19:10:51 for channel E3 model M2 compared to real data (Re). (B) The pitch (a) and phase (f) values of the particles as measured by the EPD detector relative to the real R and simulated S field. |
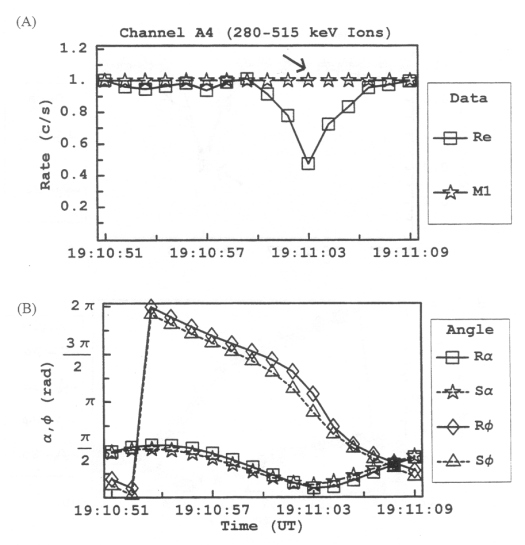 |
Figure 6.127 (A) Rate profile for feature G2-19:10:51 for channel A4 model M1 compared to real data (Re). (B) The pitch (a) and phase (f) values of the particles as measured by the EPD detector relative to the real R and simulated S field. |
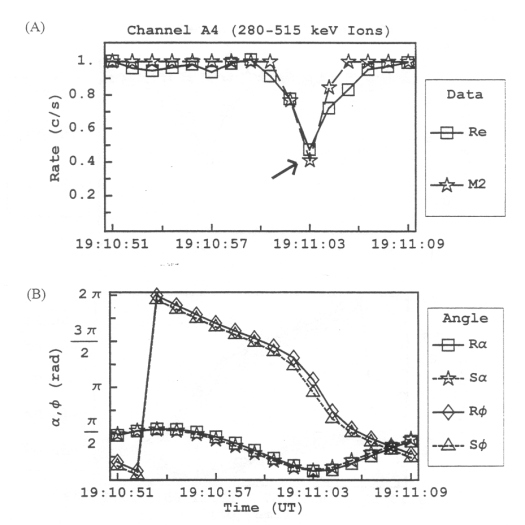 |
Figure 6.128 (A) Rate profile for feature G2-19:10:51 for channel A4 model M2 compared to real data (Re). (B) The pitch (a) and phase (f) values of the particles as measured by the EPD detector relative to the real R and simulated S field. |
Figure 6.129 shows the collimator pitch and phase scatter plot for this data point for subenergy 400 keV. The trajectory to time-reverse trace is chosen to be sublook 9; this is done to match in pitch and phase the time-reversed trajectory of the M2 model that will be done later for comparison. Figures 6.130 through 6.135 present the results of this trace, summarized in Table 6.11. It can be seen from Figure 6.130a that the ion moves toward Ganymede, but is then bounced before it can contact the surface. Also, Figure 6.132b shows that the magnetic moment of the ion varies over a wide range until it is captured by the internal field. At the point of capture, the magnetic field strength that the ion sees is 190 nT and the pitch angle is 30°. From adiabatic theory, we know that an initial magnetic field strength of 190 nT and initial pitch of 30° means that the particle will be bounced back by a field strength of approximately 760 nT. An inspection of Figure 6.132a shows that this is indeed the case (allowing for the finite gyroradius of the particle). Figures 6.134 and 6.135 illustrate the resulting bounce.
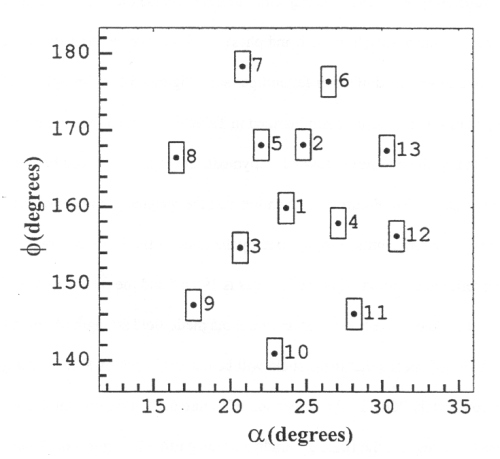 |
Figure 6.129 Collimator pitch and phase scatter plot for the sector pointed out in Figure 6.127 for M1 A4 G2-19:10:51 subenergy 400 keV. The angles are in degrees. Not a single trajectory intersected the surface of Ganymede. |
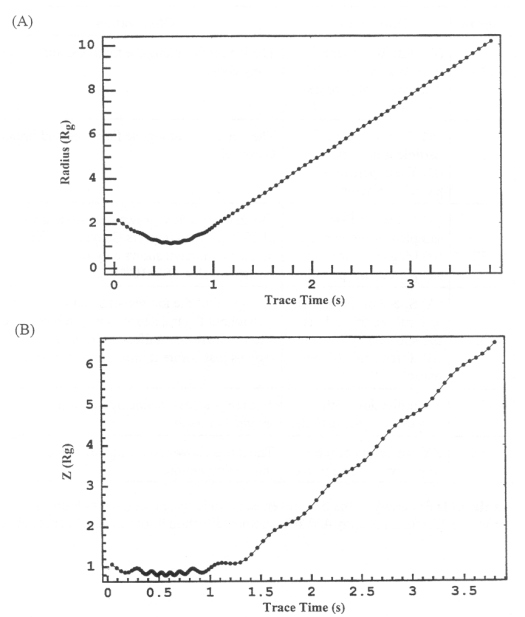 |
Figure 6.130 (A) Length of the radius vector from the center of Ganymede to the particle as a function of trace time in seconds for subenergy 400 keV sublook direction 9 for model M1 channel A4. (B) The Z component of the particle position in GSII coordinates for subenergy 400 keV sublook direction 9 for model M1 channel A4. |
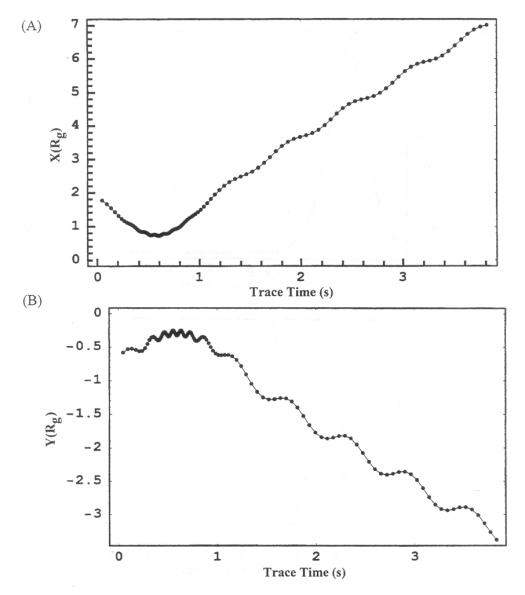 |
Figure 6.131 (A) The X component of the particle position in GSII coordinates for subenergy 400 keV sublook direction 9 for model M1 channel A4. (B) The Y component of the particle position in GSII coordinates for subenergy 400 keV sublook direction 9 for model M1 channel A4. |
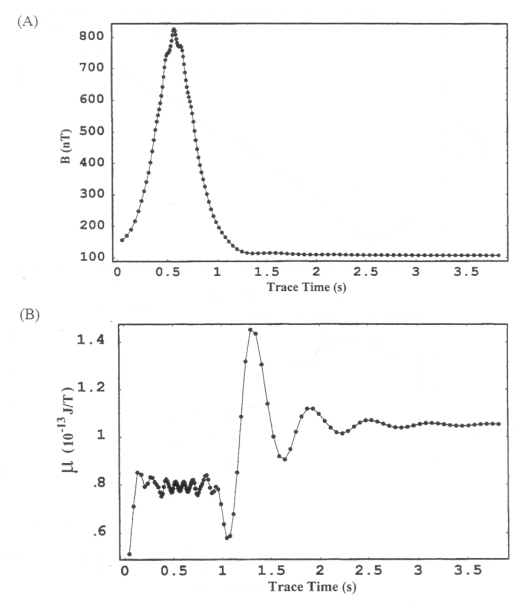 |
Figure 6.132 (A) Magnetic field at the location of the particle as a function of trace time for subenergy 400 keV sublook direction 9 for model M1 channel A4. (B) Magnetic moment at the location of the particle as a function of trace time for subenergy 400 keV sublook direction 9 for model M1 channel A4. |
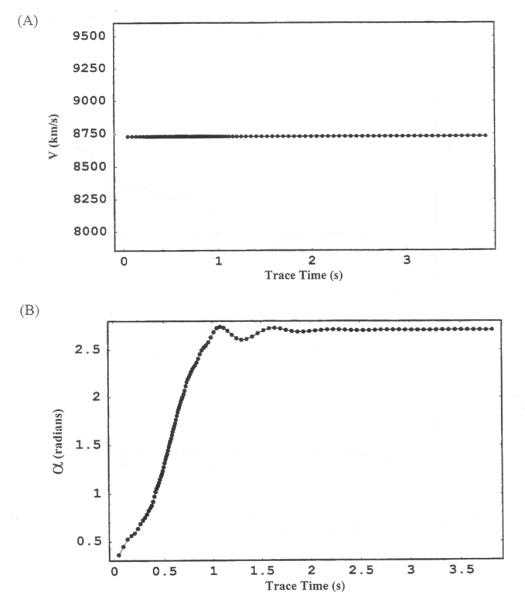 |
Figure 6.133 (A) Velocity of the particle as a function of trace time for subenergy 400 keV sublook direction 9 for model M1 channel A4. (B) Pitch angle of the particle as a function of trace time for subenergy 400 keV sublook direction 9 for model M1 channel A4. |
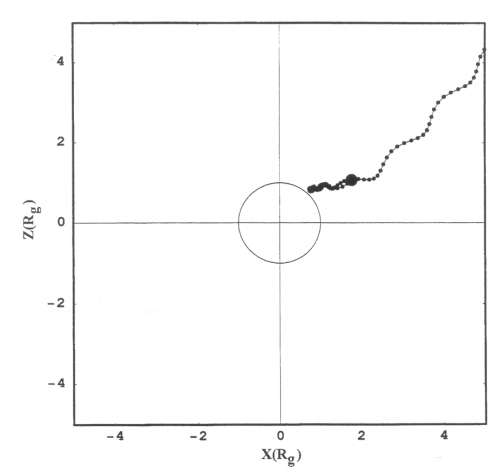 |
Figure 6.134 ZX projection of the trajectory for subenergy 400 keV sublook direction 9 for model M1 channel A4. |
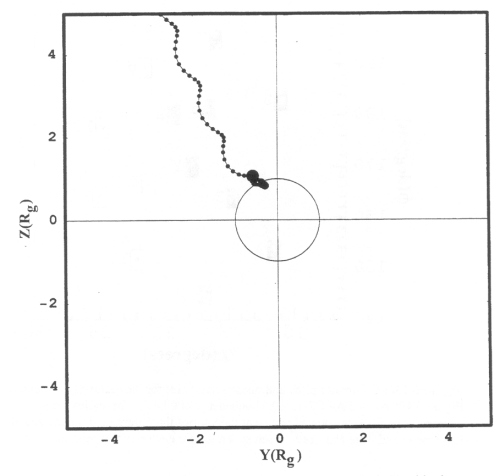 |
Figure 6.135 ZY projection of the trajectory for subenergy 400 keV sublook direction 9 for model M1 channel A4. |
Table 6.11 Summary of the time-reversed particle trace presented in Figures 6.130 through 6.135 for subenergy 400 keV sublook direction 9 for model M1 channel A4.
| Figure | Information | Observation |
| 6.130 | (A) Radius of particle from Ganymede. (B) Z component of particle trajectory. | The ion moves along the field line toward Ganymede and then turns around at the mirror point. |
| 6.131 | (A) X component of particle trajectory. (B) Y component of particle trajectory. | The ion moves along the field line toward Ganymede and then turns around at the mirror point. |
| 6.132 | (A) Magnetic field sampled by the particle. (B) Magnetic moment sampled by the particle. | The magnetic field grows steadily to a maximum value of 825 nT and then bounces back. The magnetic moment shows a gyrophase averaged value of .8H10-13 J/T on the way in toward Ganymede and a value of 1H10-13 J/T on the way out. |
| 6.133 | (A) Speed of the particle as it moves through its trajectory. (B) Pitch angle of the particle. | The speed of the ion remains constant throughout the trajectory. The pitch angle steadily increases uniformly from .37 to 2.6 radians as it moves along the field line away from Ganymede. |
| 6.134 | ZX projection of the trajectory of the particle. | The ion is shown bouncing out of the interaction region. |
| 6.135 | ZY projection of the trajectory of the particle. | The ion is shown bouncing out of the interaction region. |
Return to dissertation table of contents page.
Return to main
Galileo Table of Contents Page.
Return to Fundamental
Technologies Home Page.
Updated 8/23/19, Cameron Crane
QUICK FACTS
Mission Duration: Galileo was planned to have a mission duration of around 8 years, but was kept in operation for 13 years, 11 months, and 3 days, until it was destroyed in a controlled impact with Jupiter on September 21, 2003.
Destination: Galileo's destination was Jupiter and its moons, which it orbitted for 7 years, 9 months, and 13 days.