


Investigation of the Magnetosphere of Ganymede with Galileo's Energetic Particle Detector
Ph.D. dissertation by Shawn M. Stone, University of Kansas,
1999.
Copyright 1999 by Shawn M. Stone. Used with permission.
7.1 Feature G2-18:56:31, the Addition of Corotational Electric Field
With the addition of corotational electric field as presented in Chapter 2, the magnitude of the corotational field can be varied to infer the extent of its effects on the observed particle signatures. The magnitude of the corotational electric field considered in this work starts at the value of full corotation, about 1.25 mV. Three percentages of full corotation are attempted, 25%, 50%, and 85%. The results for model M1 electrons and ions are presented in Figures 7.1 through 7.6 and are summarized in Table 7.1. The results for channels A2 and A6, which are the same as A4, are presented in Appendix C. As can be seen in Figure 7.1, even up to 85% of full corotation, the effect on the ion absorption signatures is negligible. The electrons, however, seem to be greatly affected. A pronounced anti-moon loss cone feature forms at 50% of full corotation for channel E1, but there is little effect at 25% as shown in Figures 7.3 and 7.2 respectively. Channel E3 shows a similar effect starting at 85% of full corotation, seen in Figures 7.4 and 7.5. The F2 energy channel is virtually unaffected as can be seen in Figure 7.6.
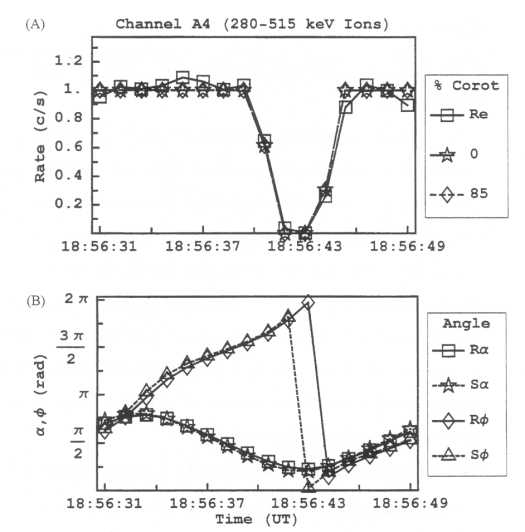 |
Figure 7.1 (A) Rate profile of model M1 energy channel A4 at .85 of full corotation for feature G2-18:56:31. There is virtually no difference between the profile obtained in magnetic field only and the one run with .85 full corotation. (B) The pitch and phase angles are computed from the look direction of the EPD detector and the appropriate magnetic field vector R for real and S for simulated. |
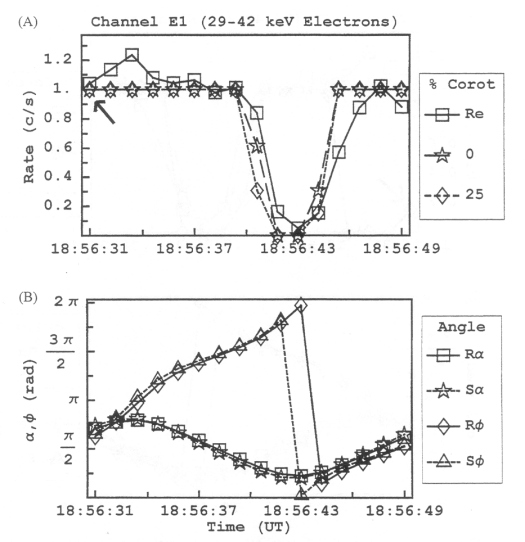 |
Figure 7.2 (A) Rate profile of model M1 energy channel E1 at .25 of full corotation for feature G2-18:56:31. The loss cone feature is beginning to show effects at this value, but not much. (B) The pitch and phase angles are computed from the look direction of the EPD detector and the appropriate magnetic field vector R for real and S for simulated. |
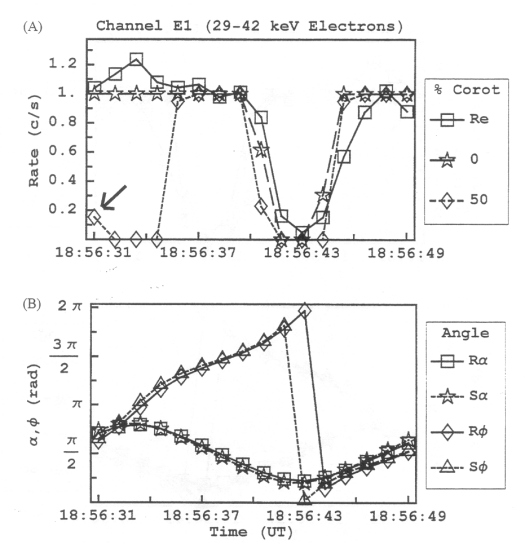 |
Figure 7.3 (A) Rate profile of model M1 energy channel E1 at .5 of full corotation for feature G2-18:56:31. The loss cone feature shows the same degree of augmentation as the .25 of full corotation case. However, a brand new loss feature appears in the anti-moon direction. (B) The pitch and phase angles are computed from the look direction of the EPD detector and the appropriate magnetic field vector R for real and S for simulated. |
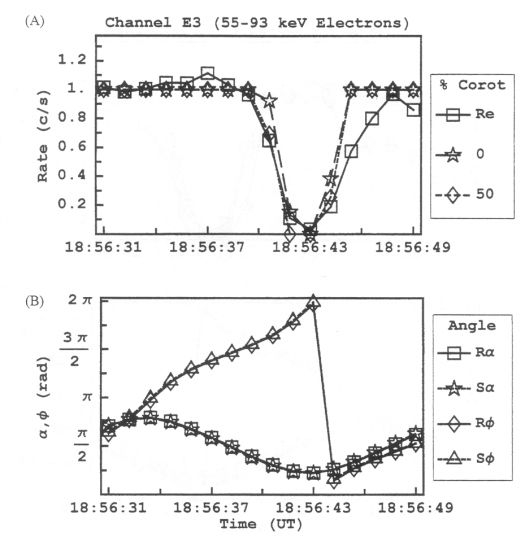 |
Figure 7.4 (A) Rate profile of model M1 energy channel E3 at .5 of full corotation for feature G2-18:56:31. Unlike the E1 channel, the E3 channel shows no effect at .5 of full corotation. (B) The pitch and phase angles are computed from the look direction of the EPD detector and the appropriate magnetic field vector R for real and S for simulated. |
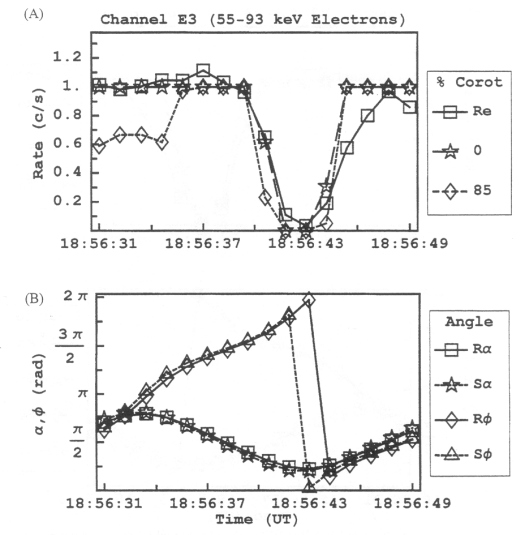 |
Figure 7.5 (A) Rate profile of model M1 energy channel E3 at .85 of full corotation for feature G2-18:56:31. A loss feature begins to develop in the anti-moon direction. (B) The pitch and phase angles are computed from the look direction of the EPD detector and the appropriate magnetic field vector R for real and S for simulated. |
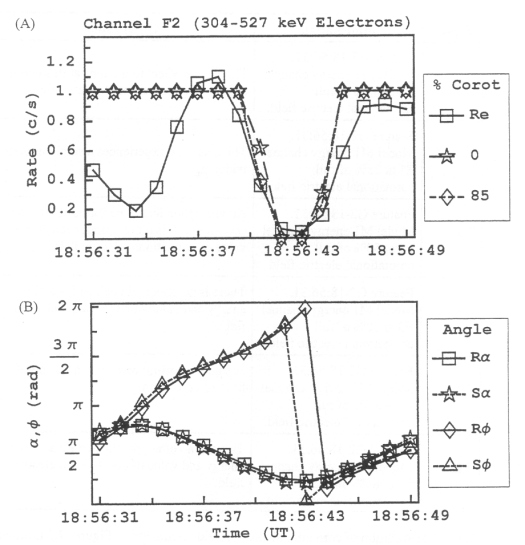 |
Figure 7.6 (A) Rate profile of model M1 energy channel F2 at .85 of full corotation for feature G2-18:56:31. Even at .85 of full corotation the F2 energy channel shows little effect. (B) The pitch and phase angles are computed from the look direction of the EPD detector and the appropriate magnetic field vector R for real and S for simulated. |
Table 7.1 Addition of corotational electric field. Summary of Figures 7.1 through 7.6 for model M1.
| Figure | Information | Observation |
| 7.1 | Feature G2-18:56:31. Model M1 energy channel A4 at 85% of full corotational electric field. | There is no effect to the ions at this energy and value of corotational electric field. |
| 7.2 | Feature G2-18:56:31. Model M1 energy channel E1 at 25% of full corotational electric field. | The loss cone experiences a small amount of widening. |
| 7.3 | Feature G2-18:56:31. Model M1 energy channel E1 at 50% of full corotational electric field. | An anti-moon loss cone forms at 50% of corotation. It is quite pronounced at this value of corotational electric field. |
| 7.4 | Feature G2-18:56:31. Model M1 energy channel E3 at 50% of full corotational electric field. | There is no effect on channel E3 at this energy and value of corotational electric field. |
| 7.5 | Feature G2-18:56:31. Model M1 energy channel E3 at 85% of full corotational electric field. | A shallow anti-moon loss cone forms at 85% of corotation. |
| 7.6 | Feature G2-18:56:31. Model M1 energy channel F2 at 85% of full corotational electric field. | There is no effect on channel F2 at this energy and value of corotational electric field |
Return to dissertation table of contents page.
Return to main
Galileo Table of Contents Page.
Return to Fundamental
Technologies Home Page.
Updated 8/23/19, Cameron Crane
QUICK FACTS
Mission Duration: Galileo was planned to have a mission duration of around 8 years, but was kept in operation for 13 years, 11 months, and 3 days, until it was destroyed in a controlled impact with Jupiter on September 21, 2003.
Destination: Galileo's destination was Jupiter and its moons, which it orbitted for 7 years, 9 months, and 13 days.