


Investigation of the Magnetosphere of Ganymede with Galileo's Energetic Particle Detector
Ph.D. dissertation by Shawn M. Stone, University of Kansas,
1999.
Copyright 1999 by Shawn M. Stone. Used with permission.
7.2 Feature G2-19:10:51, the Addition of Parallel Electric Field (continued)
M2 Results
As with model M1, it can be seen that 10 mV widens the simulated absorption signature and increases the depth. A value of 50 mV destroys the features entirely. It is obvious that the addition of parallel electric field beyond 10 mV is ruled out in the simulation for model M2 as well.
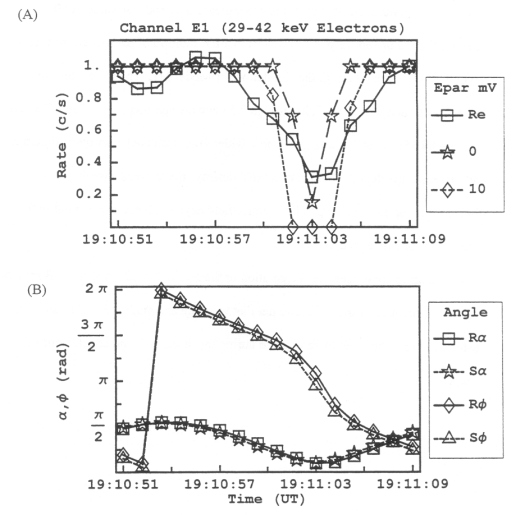 |
Figure 7.50 (A) Rate profile of model M2 energy channel E1 with an anti-parallel electric field of 10 mV. Even at this value of parallel electric field the feature is too deep. (B) The pitch and phase angles are computed from the look direction of the EPD detector and the appropriate magnetic field vector R for real and S for simulated. |
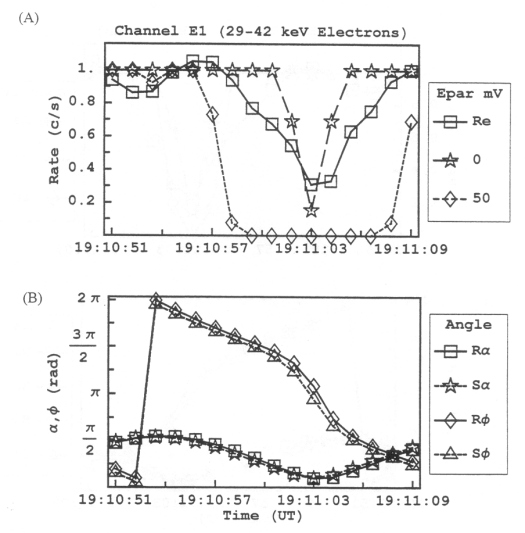 |
Figure 7.51 (A) Rate profile of model M2 energy channel E1 with an anti-parallel electric field of 50 mV. This level of parallel electric field widens the feature too much. (B) The pitch and phase angles are computed from the look direction of the EPD detector and the appropriate magnetic field vector R for real and S for simulated. |
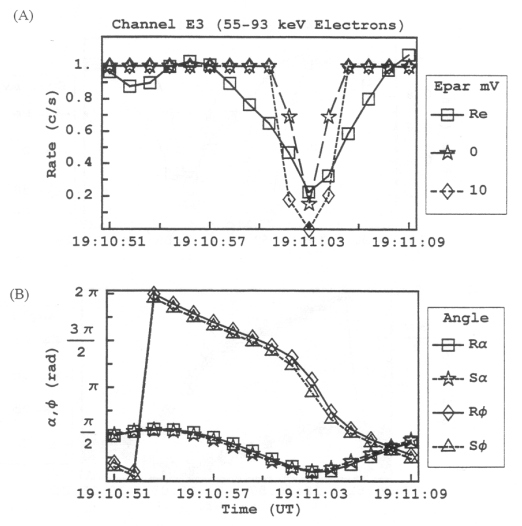 |
Figure 7.52 (A) Rate profile of model M2 energy channel E3 with an anti-parallel electric field of 10 mV. Even at this value of parallel electric field the feature is too deep. (B) The pitch and phase angles are computed from the look direction of the EPD detector and the appropriate magnetic field vector R for real and S for simulated. |
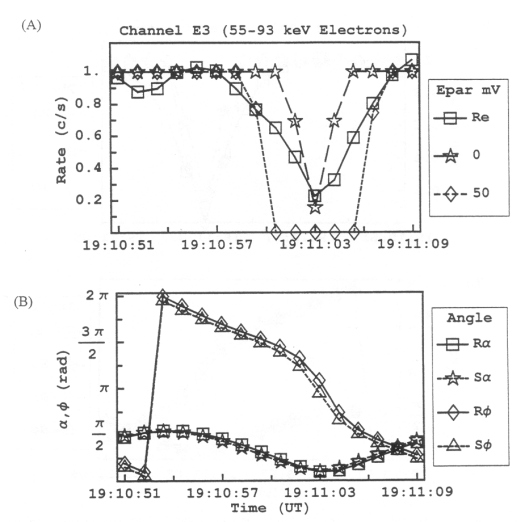 |
Figure 7.53 (A) Rate profile of model M2 energy channel E3 with an anti-parallel electric field of 50 mV. At this value of parallel electric field the feature is too deep. (B) The pitch and phase angles are computed from the look direction of the EPD detector and the appropriate magnetic field vector R for real and S for simulated. |
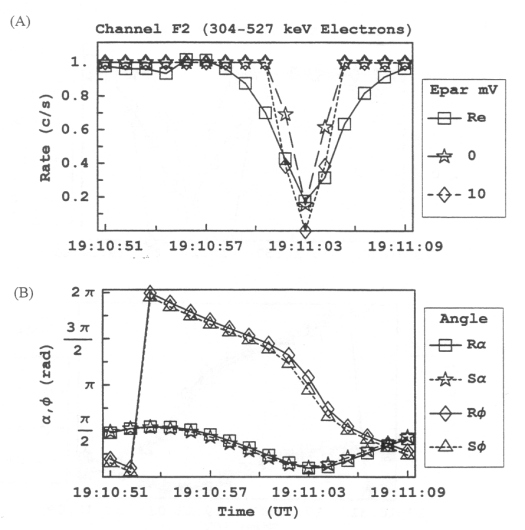 |
Figure 7.54 (A) Rate profile of model M2 energy channel F2 with an anti-parallel electric field of 10 mV. At this value of parallel electric field it seems that the feature might be matched. (B) The pitch and phase angles are computed from the look direction of the EPD detector and the appropriate magnetic field vector R for real and S for simulated. |
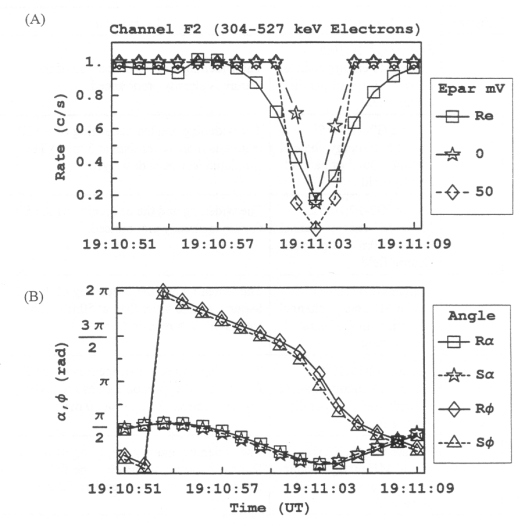 |
Figure 7.55 (A) Rate profile of model M2 energy channel F2 with an anti-parallel electric field of 50 mV. At this value of parallel electric field it seems that the feature is too deep. (B) The pitch and phase angles are computed from the look direction of the EPD detector and the appropriate magnetic field vector R for real and S for simulated. |
Table 7.8 Inclusion of anti-parallel electric field for feature G2-19:10:51: summary of Figures 7.50 through 7.55 for model M2.
| Figure | Information | Observations |
| 7.50 | Feature G2-19:10:51. Model M2 energy channel E1 with 10 mV of parallel electric field. | The widening and the deepening of the E1 feature is already pronounced. |
| 7.51 | Feature G2-19:10:51. Model M2 energy channel E1 with 50 mV of parallel electric field. | The widening and the deepening of the E1 feature is more severe than at 10 mV. The simulated feature is destroyed. |
| 7.52 | Feature G2-19:10:51. Model M2 energy channel E3 with 10 mV of parallel electric field. | The widening and the deepening of the E3 feature is already pronounced. |
| 7.53 | Feature G2-19:10:51. Model M2 energy channel E3 with 50 mV of parallel electric field. | The widening and the deepening of the E3 feature is more severe than at 10 mV. The simulated feature is destroyed. |
| 7.54 | Feature G2-19:10:51. Model M2 energy channel F2 with 10 mV of parallel electric field. | The widening and the deepening of the F2 feature is not as pronounced as the lower energy electron channels at 10 mV. |
| 7.55 | Feature G2-19:10:51. Model M2 energy channel F2 with 50 mV of parallel electric field. | The widening and the deepening of the F2 feature is starting to match. The field required to do so is greater than 50 mV. |
This chapter concludes the presentation of the results for G2. Appendix B presents significant features of the G7 encounter that were run and analyzed in the same fashion as G2. They will be referred to during the discussion and conclusions of Chapter 8.
Next: Chapter 8 Discussion and Conclusions
Return to dissertation table of contents page.
Return to main
Galileo Table of Contents Page.
Return to Fundamental
Technologies Home Page.
Updated 8/23/19, Cameron Crane
QUICK FACTS
Mission Duration: Galileo was planned to have a mission duration of around 8 years, but was kept in operation for 13 years, 11 months, and 3 days, until it was destroyed in a controlled impact with Jupiter on September 21, 2003.
Destination: Galileo's destination was Jupiter and its moons, which it orbitted for 7 years, 9 months, and 13 days.