


Investigation of the Magnetosphere of Ganymede with Galileo's Energetic Particle Detector
Ph.D. dissertation by Shawn M. Stone, University of Kansas,
1999.
Copyright 1999 by Shawn M. Stone. Used with permission.
8.6 Conclusions and Proposal for Future Study
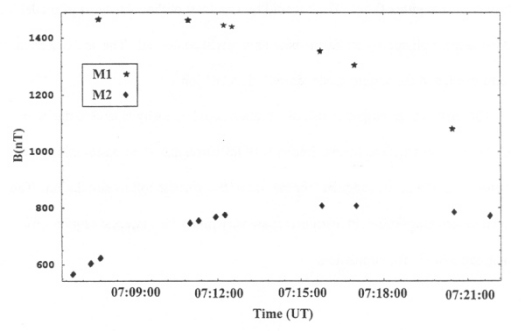
From the inspection of the fits of the magnetic field which was summarized in Tables 8.1 and 8.2, it is evident that the inclusion of the magnetopause and tail fields that result from the interaction of Ganymede’s magnetic field with the corotational plasma of Jupiter improve the fit. The question is, are these magnetic field contributions insignificant? The time-reversed particle trace results show that these contributions are important. Tables 8.3 through 8.9 are filled with examples from G2 and G7 that show model M2 can recover the absorption signatures more readily than model M1, especially at G7. With the inclusion of pitch angle scattering, all the features can be recovered with model M2, and from the standpoint of a loss cone (that is actually recovered in the model) filling in from this diffusion process. Figures 8.1 and 8.2 show a plot of the surface magnetic field that results from E3 electrons being traced from the optimal look direction back in time through the entire G2 and G7 encounters. It can easily be seen that in the regions where model M1 misses the observed absorption signatures the magnetic field maps back to regions where the surface strength is higher than model M2. This results in a bounce point that occurs above the surface of Ganymede, and the loss cone features are more apt to be missed.
Figure 8.1 Plot of the surface magnetic field of Ganymede during the G2 encounter. The surface data points were obtained from time-reversed particle following of E3 channel electrons from the optimal look direction. If the trajectory of the electron intersects the surface of Ganymede, a data point is recorded.
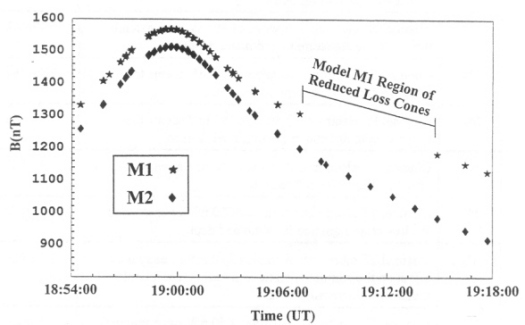
Figure 8.2 Plot of the surface magnetic field of Ganymede during the G7 encounter. The surface data points were obtained from time-reversed particle following of E3 channel electrons from the optimal look direction. If the trajectory of the electron intersects the surface of Ganymede, a data point is recorded.
In the future there is much to do. This study should include the G8 encounter as well. This encounter occurred within the plasma sheet, where the plasma density is higher than at either G2 or G7. It would be a real test of the robustness of model M2. Also, a more physically realizable boundary might be desired. This is a dissertation unto itself, and the current model doesn’t do a bad job.
The methods developed in this dissertation could be easily extended to the other Galilean moons such as Io and Europa with little trouble. The Cassini mission to Saturn is also a prime candidate for the use of this particle follow simulation. The particle and magnetic field instruments are very much the same and require little augmentation in the simulation.
Appendix A
Appendix B
Appendix C
Return to dissertation table of contents page.
Return to main
Galileo Table of Contents Page.
Return to Fundamental
Technologies Home Page.
Updated 8/23/19, Cameron Crane
QUICK FACTS
Mission Duration: Galileo was planned to have a mission duration of around 8 years, but was kept in operation for 13 years, 11 months, and 3 days, until it was destroyed in a controlled impact with Jupiter on September 21, 2003.
Destination: Galileo's destination was Jupiter and its moons, which it orbitted for 7 years, 9 months, and 13 days.