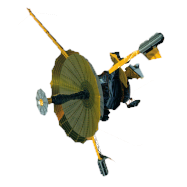
Investigation of the Magnetosphere of Ganymede with Galileo's Energetic Particle Detector
Ph.D. dissertation by Shawn M. Stone, University of Kansas,
1999.
Copyright 1999 by Shawn M. Stone. Used with permission.
1.3 Discovery of Ganymede's Magnetic Field
Galileo first encountered Ganymede during the G1 orbit on June 27, 1996. At closest approach, which occurred at 06:29:07 UT, Galileo was only 838 km (.32 Rg where Rg=2634 km) from Ganymede's surface. Soon after, on September 6, 1996, the G2 encounter took place where closest approach occurred at 18:59:45 at a distance of 264 km (.1 Rg). Figure 1.12 shows a schematic of the Ganymede flyby geometry for the G1 and G2 encounters. This was close enough for the magnetometer to detect a sudden change in magnetic field both in magnitude and direction as seen in Figure 1.13 for the G1 encounter. This change was attributed to an intrinsic magnetic field associated with Ganymede [Kivelson et al., 1996].
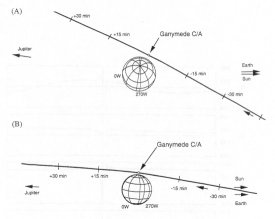 |
Figure 1.12 Encounter geometry for the G1 and G2 encounters. (A) G1: Galileo was 838 km from Ganymede at closest approach (C/A at 06:29:07) and passed by at a velocity of 7.8 km/s. (B) G2: Galileo was 264 km from Ganymede at closest approach (C/A at 18:59:45) and passed by at a velocity of 8 km/s. The coordinate system displayed here is a satellite system where longitude is measured from its prime meridian, which is the sub-Jupiter meridian [Johnson et al., 1992]. |
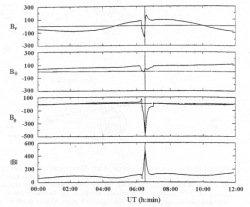 |
Figure 1.13 Magnetic field components for the G1 orbit near Ganymede 1 June 17, 1996. The components are represented in a right handed Jupiter-centered coordinate system where f is increasing westward (this is a varient of system III (1996), described in Appendix A) [Kivelson et al., 1996]. |
Ganymede's magnetic field was reported to be consistent with a simple dipole possessing an equatorial strength of 750 nT whose dipole north pole is tilted by 10° towards 200° East longitude [Kivelson et al., 1996] in a Ganymede-centered coordinate system defined here as GSI, described in Chapter 3. This result was arrived at by subtracting the background field given by the KK96 model [Khurana, 1997] from the data obtained during the G1 encounter and fitting the data to an OTD model (Offset Tilted Dipole), described in Chapter 3. This model does not take into account any other current sources in the region, namely the magnetopause and tail current.
The magnetic field configuration in the vicinity of Ganymede is then given by a vacuum superposition of the KK96 model background field (described in Chapter 3) and the Ganymede dipole. Figures 1.14 and 1.15 show the model compared to the actual magnetic field data for the G1 and G2 encounters in the GCCI coordinate system. Kivelson et al. [1996, 1997] state that it is a reasonable fit except for the f component which is attributed to the lack of the magnetopause current contribution which may lead to the over estimation of the intrinsic magnetic field strength. There have been two more encounters since G1 and G2: G7 (April 5, 1997) and G8 (May 7, 1997). Figures 1.16 and 1.17 show these results. The departure of the model from the data measured for G8 is attributed to the fact that Ganymede is in the center of the plasma sheet and most likely in a region of high plasma density [ Kivelson et al., 1998].
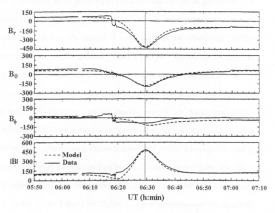 |
Figure 1.14 Components and magnitude in nT of the observed (solid line) and model (dashed line) magnetic field for the G1 encounter. The components are represented in a Ganymede-centered coordinate system referenced from Ganymede's spin axis (parallel to Jupiter's spin axis). This system is described in Appendix A. The G1 encounter took place above the plasma sheet and is assumed to be in a region of low plasma density [Kivelson et al., 1996]. |
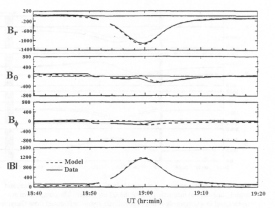 |
Figure 1.15 Components and magnitude in nT of the observed (solid line) and model (dashed line) magnetic field for the G2 encounter. The components are represented in a Ganymede-centered coordinate system referenced from Ganymede's spin axis (parallel to Jupiter's spin axis). This system is described in Chapter 3. The G2 encounter took place above the plasma sheet and is assumed to be in a region of low plasma density [Kivelson et al., 1996]. |
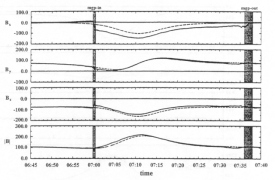 |
Figure 1.16 Components and magnitude in nT of the observed (solid line) and model (dashed line) magnetic field for the G7 encounter. The components are represented in a Ganymede-centered coordinate system referenced from Ganymede's spin axis (parallel to Jupiter's spin axis). This system is described in Appendix A. The G7 encounter took place below the plasma sheet and is assumed to be in a region of low plasma density [Kivelson et al., 1998]. |
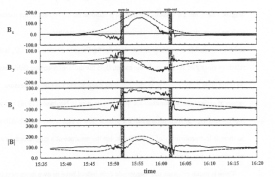 |
Figure 1.17 Components and magnitude in nT of the observed (solid line) and model (dashed line) magnetic field for the G8 encounter. The components are represented in a Ganymede-centered coordinate system referenced from Ganymede's spin axis (parallel to Jupiter's spin axis). This system is described in Appendix A. The G8 encounter took place near the center of the plasma sheet and is assumed to be in a region of high plasma density [Kivelson et al., 1996]. |
Next: 1.4 The Magnetosphere of Ganymede
Return to dissertation table of contents page.
Return to main
Galileo Table of Contents Page.
Return to Fundamental
Technologies Home Page.
Updated 8/23/19, Cameron Crane
QUICK FACTS
Mission Duration: Galileo was planned to have a mission duration of around 8 years, but was kept in operation for 13 years, 11 months, and 3 days, until it was destroyed in a controlled impact with Jupiter on September 21, 2003.
Destination: Galileo's destination was Jupiter and its moons, which it orbitted for 7 years, 9 months, and 13 days.
