Investigation of the Magnetosphere of Ganymede with Galileo's Energetic Particle Detector
Ph.D. dissertation by Shawn M. Stone, University of Kansas,
1999.
Copyright 1999 by Shawn M. Stone. Used with permission.
4.8.2 Solving and Mapping the Boundary
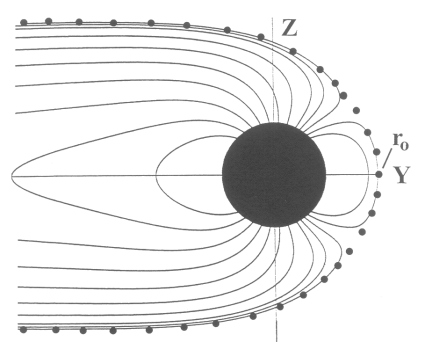
The external multipole model given in Section 4.3 is unphysical outside the magnetopause boundary, as unphysical as an image dipole, since the terms are directly proportional to r. It is essential, then, to map the boundary of the magnetopause and tail field so that it can be turned off when the particles exit the magnetosphere of Ganymede. The ideal method to approach this problem would have been to propose a boundary and then impose currents upon this boundary and integrate via the Biot-Savart law. Unfortunately, the magnetic field geometry of Ganymede is more complicated than a dipole. However, it is satisfactory to take the solution in Tables 4.8 and 4.9 and trace field lines until a balance is reached between the internal and external field lines, thus tracing out the boundary where the tangential components of the magnetic field vanish. The first guess boundary is based on a dipole with magnetic moment of the g10 of the respective encounter. Figure 4.27 shows a trace for the G2 model. The function that is used for the fit is

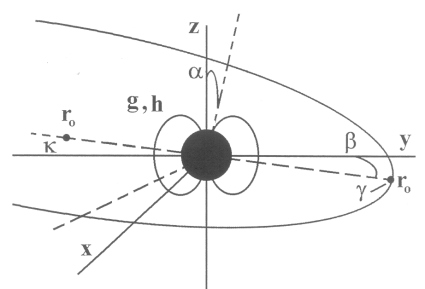
where zo is the offset distance of the boundary on an axis where the boundary is completely axially symmetric, denoted here as axial coordinates. This boundary is then rotated about the GSII X axis by α and GSII Z axis by β (Figure 4.28) until the inbound and outbound crossings reach a minimum, thus attaining the preliminary abberation angles from corotation. The boundary is then refit in the same manner as above and the process repeated until there is no significant change in the aberration angles (less than a degree). Table 4.10 lists the coefficients of Equation [4.35] for G2 and G7 along with the aberration angles that were derived from this process.
Figure 4.27 Magnetic line trace for the G2 encounter where ro=2.0 Rg. The magnetic field from the internal Ganymede sources and the external Jovian field combine to define the boundary which is then sampled, and the data gathered from this sampling is fit to Equation [4.35].

Figure 4.28 Diagram representing the variation of the preliminary boundary by the aberration angles α and β.

Table 4.10 The boundary parameters for G2 and G7 derived from the fit of Equation [4.35]. The offset distance ro was defined as 2.0 Rg for the G2 encounter.
| G2 Boundary Parameters |
Mean | RMS Error |
| ρ0 | 0.0 Rg | 0.0 Rg |
| ρ1 | 1.552 Rg | ±0.002 Rg |
| ρ2 | 2.436 Rg | ±0.006 Rg |
| ρ3 | -6.992 Rg | ±0.007 Rg |
| ρ4 | 9.527 Rg | ±0.001 Rg |
| ρ5 | -10.515 Rg | ±0.002 Rg |
| ρ6 | 7.891 Rg | ±0.005 Rg |
| zo | 2.0 Rg | ±0.0 Rg |
| α | 10º | ±1.0º |
| β | -35º | ±1.0º |
| G7 Boundary Parameters |
Mean | RMS Error |
| ρ0 | 0.0 Rg | 0.0 Rg |
| ρ1 | 2.429 Rg | ±0.005 Rg |
| ρ2 | 0.524 Rg | ±0.003 Rg |
| ρ3 | -1.180 Rg | ±0.009 Rg |
| ρ4 | -2.790 Rg | ±0.003 Rg |
| ρ5 | 6.579 Rg | ±0.004 Rg |
| ρ6 | -4.525 Rg | ±0.002 Rg |
| zo | 2.6 Rg | ±.1 Rg |
| α | 30º | ±1.0º |
| β | 40º | ±1.0º |
Next: 4.8.3 Adding Finite Thickness to the Boundary
Return to dissertation table of contents page.
Return to main
Galileo Table of Contents Page.
Return to Fundamental
Technologies Home Page.
Updated 8/23/19, Cameron Crane
QUICK FACTS
Mission Duration: Galileo was planned to have a mission duration of around 8 years, but was kept in operation for 13 years, 11 months, and 3 days, until it was destroyed in a controlled impact with Jupiter on September 21, 2003.
Destination: Galileo's destination was Jupiter and its moons, which it orbitted for 7 years, 9 months, and 13 days.


