Investigation of the Magnetosphere of Ganymede with Galileo's Energetic Particle Detector
Ph.D. dissertation by Shawn M. Stone, University of Kansas,
1999.
Copyright 1999 by Shawn M. Stone. Used with permission.
6.3.2 Feature G2-18:58:31
This feature also presents a loss cone for both the ion and electron channels, and an anti-moon loss cone for the electrons. The pitch and phase angles are matched well by both models. Figures 6.85 and 6.86 show the loss cone feature for the Channel A4 ions. As in feature G2-18:56:31, the ions are well reproduced for both magnetic field models in one shot mode. However, it is the electron channels again where the differences surface. Figure 6.87 shows electron rate profiles normalized to 90º pitch for channels E1, E3, and F2. The presence of an anti-moon loss cone can easily be seen, and it is shallow for the low energy electrons and almost complete for the higher energy electrons. Figures 6.88 and 6.89 show the one shot mode results for the electron channel E3 for model M1 and model M2 respectively. The loss cone feature is recovered nicely for both models. The next step is to see the effect of scattering when extended bounce mode is initiated. Figures 6.90 through 6.93 show the results for model M1 channels E3 and F2. It can be seen that the effects of scattering for this model, at least for the anti-moon loss cone region, begin to fill in with increasing scattering coefficient. However, the correspondence is choppy.
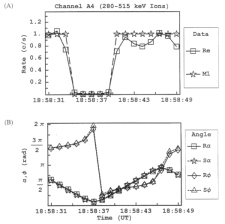 |
Figure 6.85 (A) Simulated M1 and real (Re) rate profile for feature G2-18:58:31 of Channel A4 normalized to 90º of pitch. (B) The pitch and phase angles are computed from the look direction of the EPD detector and the appropriate magnetic field vector R for real and S for simulated. |
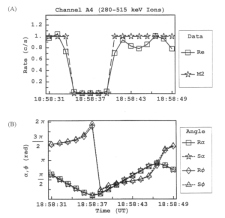 |
Figure 6.86 (A) Simulated M2 and real (Re) rate profile for feature G2-18:58:31 of Channel A4 normalized to 90º of pitch. (B) The pitch and phase angles are computed from the look direction of the EPD detector and the appropriate magnetic field vector R for real and S for simulated. |
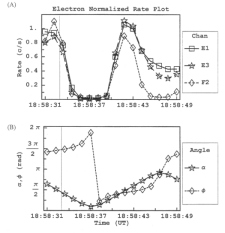 |
Figure 6.87 (A) Rate profile for feature G2-18:58:31 for the electrons as measured by the EPD instrument during the G2 encounter. An anti-loss cone exists that is partially filled in for low energy electrons (E1 and E3), and empty for the high energy electrons (F2). (B) The pitch (a) and phase (f) values of the particles as measured by the EPD detector. |
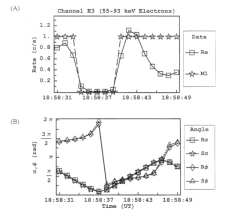 |
Figure 6.88 (A) Simulated M1 and real (Re) rate profile for feature G2-18:58:31 of Channel E3 normalized to 90º of pitch. (B) The pitch and phase angles are computed from the look direction of the EPD detector and the appropriate magnetic field vector R for real and S for simulated. |
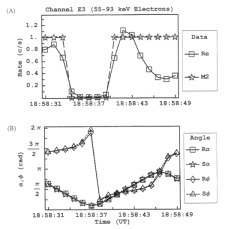 |
Figure 6.89 (A) Simulated M2 and real (Re) rate profile for feature G2-18:58:31 of Channel E3 normalized to 90º of pitch. (B) The pitch and phase angles are computed from the look direction of the EPD detector and the appropriate magnetic field vector R for real and S for simulated. |
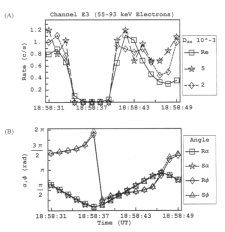 |
Figure 6.90 (A) Simulated M1 and real (Re) rate profile for feature G2-18:58:31 of Channel E3 normalized to 90º of pitch. The simulated runs are done in extended bounce mode with scattering included. (B) The pitch and phase angles are computed from the look direction of the EPD detector and the appropriate magnetic field vector R for real and S for simulated. |
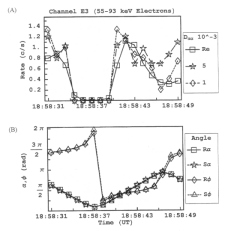 |
Figure 6.91 (A) Simulated M1 and real (Re) rate profile for feature G2-18:58:31 of Channel E3 normalized to 90º of pitch. The simulated runs are done in extended bounce mode with scattering included. (B) The pitch and phase angles are computed from the look direction of the EPD detector and the appropriate magnetic field vector R for real and S for simulated. |
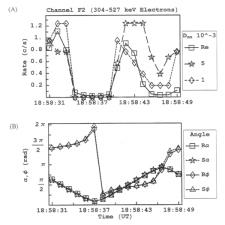 |
Figure 6.92 (A) Simulated M1 and real (Re) rate profile for feature G2-18:58:31 of Channel F2 normalized to 90º of pitch. The simulated runs are done in extended bounce mode with scattering included. (B) The pitch and phase angles are computed from the look direction of the EPD detector and the appropriate magnetic field vector R for real and S for simulated. |
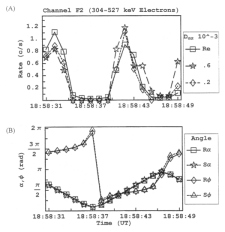 |
Figure 6.93 (A) Simulated M1 and real (Re) rate profile for feature G2-18:58:31 of Channel F2 normalized to 90º of pitch. The simulated runs are done in extended bounce mode with scattering included. (B) The pitch and phase angles are computed from the look direction of the EPD detector and the appropriate magnetic field vector R for real and S for simulated. |
Return to dissertation table of contents page.
Return to main
Galileo Table of Contents Page.
Return to Fundamental
Technologies Home Page.
Updated 8/23/19, Cameron Crane
QUICK FACTS
Mission Duration: Galileo was planned to have a mission duration of around 8 years, but was kept in operation for 13 years, 11 months, and 3 days, until it was destroyed in a controlled impact with Jupiter on September 21, 2003.
Destination: Galileo's destination was Jupiter and its moons, which it orbitted for 7 years, 9 months, and 13 days.
