Investigation of the Magnetosphere of Ganymede with Galileo's Energetic Particle Detector
Ph.D. dissertation by Shawn M. Stone, University of Kansas,
1999.
Copyright 1999 by Shawn M. Stone. Used with permission.
6.4.2 Feature G2-19:10:51 (continued)
In extended bounce mode with the implementation of scattering, results are shown in Figures 6.143 and 6.144 for model M1 for channel E3, and results are shown in Figures 6.145 and 6.146 for model M2 for channel E3. The implementation of scattering starts to deplete the loss cone of particles. The larger the scattering the more shallow the feature. However, model M2 fills in with increased scattering as is physically understandable. The correlations of the simulations for model M2 with the real feature data are presented in Figures 6.147 (E1), Figure 6.148 (E3), and Figure 6.149. The correlations of the simulations for model M1 with the real feature data are presented in Figures 6.150 (E1), Figure 6.151 (E3), and Figure 6.152 (F2).
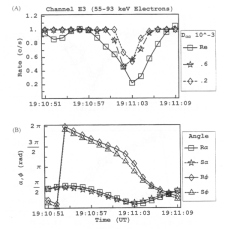 |
Figure 6.143 (A) Simulated M1 and real (Re) rate profile for feature G2-19:10:51 of Channel E3 normalized to 90º of pitch. The simulated runs are done in extended bounce mode with scattering included. (B) The pitch and phase angles are computed from the look direction of the EPD detector and the appropriate magnetic field vector R for real and S for simulated. |
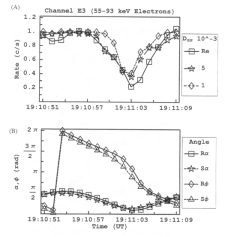 |
Figure 6.144 (A) Simulated M1 and real (Re) rate profile for feature G2-19:10:51 of Channel E3 normalized to 90º of pitch. The simulated runs are done in extended bounce mode with scattering included. (B) The pitch and phase angles are computed from the look direction of the EPD detector and the appropriate magnetic field vector R for real and S for simulated. |
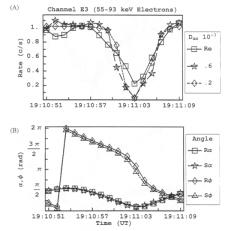 |
Figure 6.145 (A) Simulated M2 and real (Re) rate profile for feature G2-19:10:51 of Channel E3 normalized to 90º of pitch. The simulated runs are done in extended bounce mode with scattering included. (B) The pitch and phase angles are computed from the look direction of the EPD detector and the appropriate magnetic field vector R for real and S for simulated. |
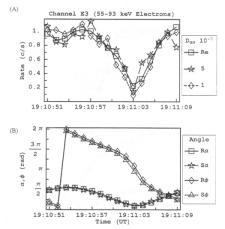 |
Figure 6.146 (A) Simulated M2 and real (Re) rate profile for feature G2-19:10:51 of Channel E3 normalized to 90º of pitch. The simulated runs are done in extended bounce mode with scattering included. (B) The pitch and phase angles are computed from the look direction of the EPD detector and the appropriate magnetic field vector R for real and S for simulated. |
 |
Figure 6.147 Correlation of feature G2-19:10:51 with simulated M2-E1 data for varying values of Daa. This graph shows that the scattering coefficient with the highest correlation is Daa = 3x10⁻³ s. |
 |
Figure 6.148 Correlation of feature G2-19:10:51 with simulated M2-E3 data for varying values of Daa. This graph shows that the scattering coefficient with the highest correlation is Daa = 1x10⁻³ s. |
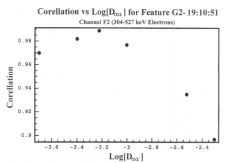 |
Figure 6.149 Correlation of feature G2-19:10:51 with simulated M2-F2 data for varying values of Daa. This graph shows that the scattering coefficient with the highest correlation is Daa = 6x10⁻⁴ s. |
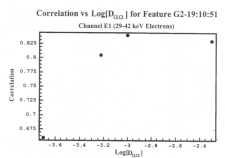 |
Figure 6.150 Correlation of feature G2-19:10:51 with simulated M1-E1 data for varying values of Daa. This graph shows that the scattering coefficient with the highest correlation is Daa = 1x10⁻³ s. |
 |
Figure 6.151 Correlation of feature G2-19:10:51 with simulated M1-E3 data for varying values of Daa. This graph shows that the scattering coefficient with the highest correlation is Daa = 3x10⁻³ s. |
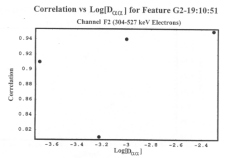 |
Figure 6.152 Correlation of feature G2-19:10:51 with simulated M1-F2 data for varying values of Daa. This graph shows that the scattering coefficient with the highest correlation is Daa = 5x10⁻³ s. |
Table 6.13 Summary of features of model M1 and M2 not included in the main body of the text for the outbound portion of the G2 encounter. The corresponding graph is presented in Appendix C. The precise graph is indicated in the description column.
| Feature | Model | Description |
| G2-19:08:51 | M1 | Electron channel E1 shows that in extended bounce mode there is virtually no anti-moon loss cone. This is contrary to what is observed. With the addition of scattering, the feature can be matched. However, it is matched with an increase in scattering. See Figures C.34 to C.36. |
| G2-19:08:51 | M2 | Electron channel E1 shows that in extended bounce mode there is an anti-moon loss cone. With the addition of scattering the feature begins to fill in and match the observed feature. See Figures C.37 to C.39. |
| G2-19:10:51 | M1 | The ion channels A2 and A6 miss the loss cone. Electron channels E1 and F2 show an existence of a loss cone, but it is far more shallow than actually observed. With the addition of scattering, the feature can be matched. However, it is matched with an increase in scattering. See Figures C.40 to C.47. |
| G2-19:10:51 | M2 | The ion channels A2 and A6 predict the existence of and nearly match the observed loss cone. Electron channels E1 and F2 show an existence of a loss cone; the depth is matched but the shape is narrower than observed. With the addition of scattering, the feature fills out to the proper width. See Figures C.48 to C.54. |
This concludes the presentation of results for G2 with magnetic field and scattering. The length of the chapter is quite long, so a review is in order. For the inbound portion of the G2 encounter, both models predicted nips out of the particle distribution for the ion channels that randomly occurred in pitch and phase (due to the null point interaction). Although they occurred in both models, model M2 was more successful in replication of depth and time of occurrence. The occurrence of the first electron loss cone was too early in model M1, and 20 s off for model M2. For closest approach, both models were nearly identical, and both recovered the observed absorption features well. For the outbound portion, model M2 was able to recover the observed loss cone features very well. Model M1, however, was unable to match the features in depth and missed most altogether. With the inclusion of scattering, model M2 was able to match the outbound features with more accuracy.
Chapter 7 explores two features for the G2 encounter with corotational and parallel electric field.
Next: Chapter 7 Corotational and Parallel Electric Fields: G2 Encounter
Return to dissertation table of contents page.
Return to main
Galileo Table of Contents Page.
Return to Fundamental
Technologies Home Page.
Updated 8/23/19, Cameron Crane
QUICK FACTS
Mission Duration: Galileo was planned to have a mission duration of around 8 years, but was kept in operation for 13 years, 11 months, and 3 days, until it was destroyed in a controlled impact with Jupiter on September 21, 2003.
Destination: Galileo's destination was Jupiter and its moons, which it orbitted for 7 years, 9 months, and 13 days.
