


Investigation of the Magnetosphere of Ganymede with Galileo's Energetic Particle Detector
Ph.D. dissertation by Shawn M. Stone, University of Kansas,
1999.
Copyright 1999 by Shawn M. Stone. Used with permission.
5.1 Setting Up The Encounter
The accurate determination of the position of Galileo and the look direction of the EPD instrument is essential to the reproduction of the absorption signatures. It was shown in Chapter 3 how these quantities were ascertained. The program EphemerisGen utilizes rate files, provided by the EPD team at the Applied Physics Laboratory (APL), which contain the right ascension and declination angles of the spacecraft spin axis as well as the step and sector position of the EPD instrument. Each record is time tagged with an ephemeris time which is used in conjunction with the SPICE kernels (Appendix A) to calculate the position of Galileo relative to Ganymede, the unit look vector of the EPD instrument, and the position of Galileo relative to Jupiter, all in GSII coordinates. This ASCII file is supplied, along with an ASCII file with the actual magnetic field vector measured by the magnetometer, in GSII coordinates as input to Particle_Follow.
5.1.1 Distribution of Particles
The EPD instrument was discussed in detail in Chapter 3. Figure 3.4 shows the 0° end of the LEMMS detector. The collimator has an acceptance angle of 15°. Any particle that enters this aperture registers in one of the energy channels. The respective passbands for these energy channels were presented in Table 3.2 and Table 3.4. For example, an electron that enters the acceptance angle of the collimator with an energy of 350 keV will register in channel F2. In fact, any electron with an energy between 304 and 527 keV will register as a count in the F2 channel. The actual count rate measured by the detector is then the integral of counts over the collimator acceptance solid angle and the passband energy of the detector channel.
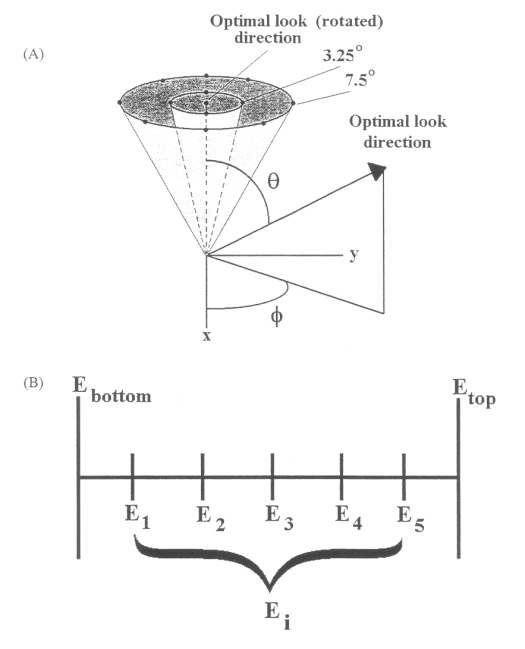
To simulate the count rate of each energy channel, Particle_Follow breaks the look direction of the LEMMS detector into 13 sub-look directions distributed within the 15° solid angle; see Figure 5.1a. This is done by the calculation of the two angles, q and f, required to rotate a unit vector aligned with the z axis in GSII into the look direction, thus defining a rotation matrix. Then, with the z axis defined as the optimal look direction, two cones are placed within the solid angle, one at 3.25° and one at 7.5°. The inner cone has four look directions distributed uniformly around it, one at each of the azimuthal angles f=(l -1)p/2 where l=1...4. The outer cone has eight sub-look directions distributed around it according to f=(l -1)p/4 where l=1...8. These 13 look directions within the solid angle are then rotated back into the look direction by the rotation matrix derived from the transformation of the original look direction.
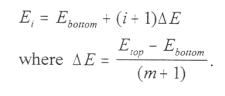
The passband energy of each channel is broken up into m energies depending on the resolution desired; see Figure 5.1b. The energies within the passband are distributed according to the formula
 |
[5.1] |
It follows that for each individual look direction, the simulation allows for 39 (3 energies within the passband) or 65 (5 energies within the passband) individual trajectories to be traced per look direction. These numbers represent the maximum count rate of the simulated detector.
Figure 5.1 (A) Schematic of the optimal look direction of the EPD instrument broken into 13 sub-look directions within the solid angle as described above. (B) Passband of an energy channel with boundaries Etop and Ebottom broken into five sub-energies labeled as Ei, described also above.
5.1.2 Particle Initial Conditions
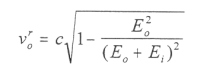
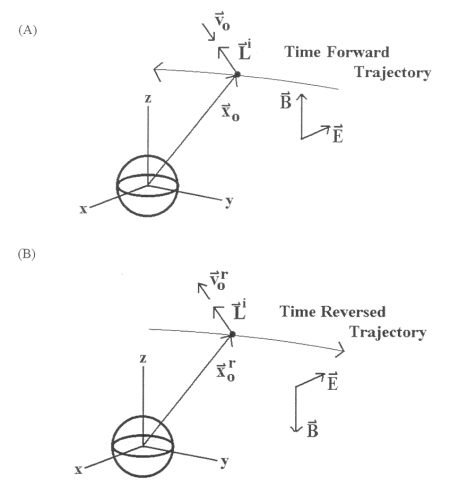
While the spacecraft is moving through the Ganymede region, the EPD instrument is detecting particles as shown in Figure 5.2a. In the time forward sense, the EPD instrument is looking in a direction L when it detects a particle with velocity no at xo. Under time reversal (Figure 5.2b) the initial velocity nor = -no is in the look direction while the magnitude of the velocity is calculated from the respective energy channel the particle was detected in. If Ei is the sub-energy within the passband of the detector that measures the particle (Ei is also the kinetic energy of the particle) then the magnitude of the time reversed velocity is calculated
 |
[5.2] |
where Eo is the rest mass energy of the particle and c is the speed of light.
Figure 5.2 (A) Time forward trajectory of the Galileo spacecraft through the magnetosphere of Ganymede (note B and E are not in the correct directions). The specific sub-look direction i is denoted as Li, and the particle detected in this look direction at xo has a velocity of no. (B) The system under time reversal. The time reversed initial conditions of the particle are shown as xor and -nor. Under time reversal B --> -B and E --> E.
Next: 5.2 Time Reversed Particle Tracing
Return to dissertation table of contents page.
Return to main
Galileo Table of Contents Page.
Return to Fundamental
Technologies Home Page.
Updated 8/23/19, Cameron Crane
QUICK FACTS
Mission Duration: Galileo was planned to have a mission duration of around 8 years, but was kept in operation for 13 years, 11 months, and 3 days, until it was destroyed in a controlled impact with Jupiter on September 21, 2003.
Destination: Galileo's destination was Jupiter and its moons, which it orbitted for 7 years, 9 months, and 13 days.