


Investigation of the Magnetosphere of Ganymede with Galileo's Energetic Particle Detector
Ph.D. dissertation by Shawn M. Stone, University of Kansas,
1999.
Copyright 1999 by Shawn M. Stone. Used with permission.
6.1 Encounter Geometry and Overview of the G2 Encounter
Galileo made its second pass by Ganymede on September 6, 1996 (UT 96250). The G2 encounter covers an interval of about 50 minutes between 96-250T18:35:00 to 96-250T19:25:00. Figures 6.1 through 6.3 show the Cartesian coordinate projections of Galileo’s trajectory for G2 in GSII coordinates. At closest approach, CA19:00:00, Galileo was only 264 km from the surface of Ganymede. Figure 6.4 shows the radial distance of Galileo from the center of Ganymede as a function of time. The crossings of the magnetopause boundary occur from 18:49:32 to 18:50:15 and 19:22:31 to 19:23:07 UT [Kivelson et al., 1998]. For the presentation of the results that follow, it is convenient to divide up the encounter into three regions denoted by: inbound 18:35:00 to 18:55:51, closest approach 18:55:51 to 19:05:00, and outbound 19:05:00 to 19:25:00.
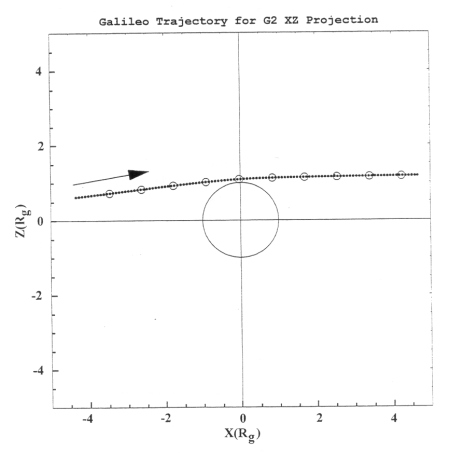 |
Figure 6.1 ZX projection of the G2 encounter in GSII coordinates. The circles along the trajectory are separated by five minute intervals, the first starting at 18:40:00 UT. |
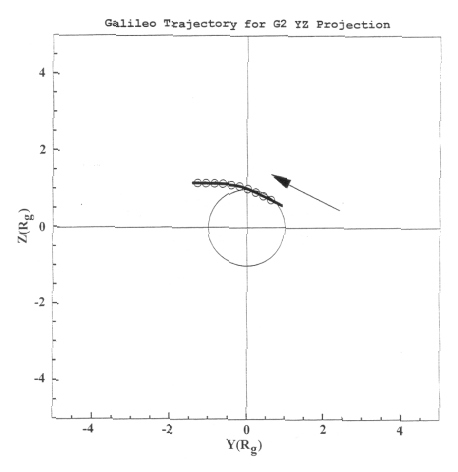 |
Figure 6.2 ZY projection of the G2 encounter in GSII coordinates. The circles along the trajectory are separated by five minute intervals, the first starting at 18:40:00 UT. |
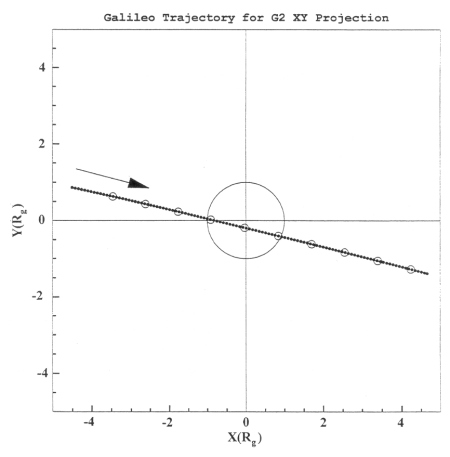 |
Figure 6.3 XY projection of the G2 encounter in GSII coordinates. The circles along the trajectory are separated by five minute intervals, the first starting at 18:40:00 UT. |
 |
Figure 6.4 Radial distance to the center of Ganymede as a function of encounter time. |
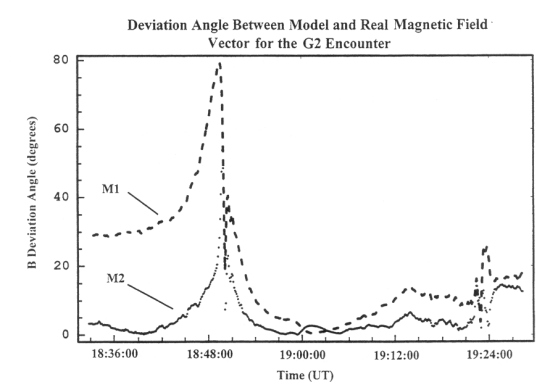
The dependence of the tracings on the initial pitch and phase is very important. In regions where there is significant deviation of the model from that of the measured magnetic field, features can appear where there are none or vice versa. Figure 6.5 shows the angle between the measured magnetic field vector and the appropriate model magnetic field vector. The most significant deviation for model M1 is shown on the inbound pass. Both models have a significant deviation near the boundary. Inside, near closest approach, both models are near the measured vector. On the outbound phase, the model magnetic field vector of model M1 tends to deviate more than that of model M2.
Figure 6.5 Angle of deviation between the measured magnetic field vector with that of the model field vector.
Next: 6.2 Inbound Results
Return to dissertation table of contents page.
Return to main
Galileo Table of Contents Page.
Return to Fundamental
Technologies Home Page.
Updated 8/23/19, Cameron Crane
QUICK FACTS
Mission Duration: Galileo was planned to have a mission duration of around 8 years, but was kept in operation for 13 years, 11 months, and 3 days, until it was destroyed in a controlled impact with Jupiter on September 21, 2003.
Destination: Galileo's destination was Jupiter and its moons, which it orbitted for 7 years, 9 months, and 13 days.