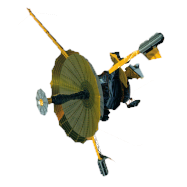
Investigation of the Magnetosphere of Ganymede with Galileo's Energetic Particle Detector
Ph.D. dissertation by Shawn M. Stone, University of Kansas,
1999.
Copyright 1999 by Shawn M. Stone. Used with permission.
6.2 Inbound Results
As has been indicated, the inbound encounter region encompasses the time interval between 18:35:00 and 18:55:31 UT. The locations of the features that are to be presented are shown in Figure 6.6 for model M1 and Figure 6.7 for model M2. The fundamental difference between the magnetic field geometry is evident in these two figures. Model M1 shows an effect on the Jovian background field as early as 18:43:11 UT and the first field line connection to Ganymede at 18:48:24. Model M2 predicts the first field line connecting to Ganymede at 18:49:24. The real data collected for the ions (channels A0 to A8) shows little slivers taken out of the distribution that do not seem to be ordered in time, pitch, or phase; see Figure 6.8 for example. These features appear at seemingly random intervals between 18:45:00 and 18:52:00. The electrons do not show such an effect. The electrons, however, show the first loss cone signature, predicting the first field line connecting to the surface of Ganymede (occurring at about 18:49:40 UT, shown in Figure 6.9).
 |
Figure 6.6 Model 1 inbound phase field line tracing. The time in UT is indicated at each feature location. It is important to note that M1 shows an effect on the Jovian field as early as 18:43:11 UT. Also, the first field line connection to Ganymede occurs at 18:48:11 UT. |
 |
Figure 6.7 Model 2 inbound phase field line tracing. The time in UT is indicated at each feature location. The first field line predicted to connect to Ganymede occurs at 18:49:31 UT. |
Figure 6.8 (A) Rate profile for feature G2-18:50:31 for the ions as measured by the EPD instrument during the G2 encounter. Little dips in the rates can be seen at times that do not seem to have energy, pitch, or phase in common. (B) The pitch (a) and phase (f) values of the particles as measured by the EPD detector.

Figure 6.9 (A) Rate profile for feature G2-18:49:31 for the electrons as measured by the EPD instrument during the inbound phase of the G2 encounter. This presents the first loss cone associated with Ganymede, placing the occurrence of the first field line connecting to the surface of Ganymede. (B) The pitch (a) and phase (f) values of the particles as measured by the EPD detector.

Next: 6.3 Closest Approach Results
Return to dissertation table of contents page.
Return to main
Galileo Table of Contents Page.
Return to Fundamental
Technologies Home Page.
Updated 8/23/19, Cameron Crane
QUICK FACTS
Mission Duration: Galileo was planned to have a mission duration of around 8 years, but was kept in operation for 13 years, 11 months, and 3 days, until it was destroyed in a controlled impact with Jupiter on September 21, 2003.
Destination: Galileo's destination was Jupiter and its moons, which it orbitted for 7 years, 9 months, and 13 days.


