


Investigation of the Magnetosphere of Ganymede with Galileo's Energetic Particle Detector
Ph.D. dissertation by Shawn M. Stone, University of Kansas,
1999.
Copyright 1999 by Shawn M. Stone. Used with permission.
6.3 Closest Approach Results
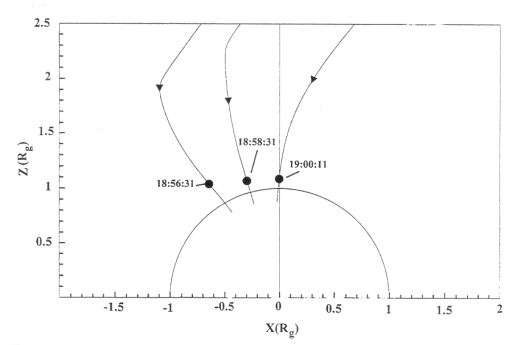
The closest approach region of the G2 encounter encompasses the time interval between 18:55:51 to 19:05:00 UT. Figures 6.54 and 6.55 show three field line tracings for three typical adsorption features observed by Galileo for model M1 and model M2, respectively. Of course, there are many more features present in the closest approach region; these embody the characteristics of them all. Each rate profile presents a loss cone adsorption for the ions and electrons, with the electrons also exhibiting loss cones in the anti-moon direction. Not all energy channels for these two features are presented here in Chapter 6. Table 6.10 gives information and some details on the plots not shown here; they are included in Appendix C.
Figure 6.54 Model 1 inbound field line tracings. The time in UT is indicated at each feature location.

Figure 6.55 Model 2 closest approach field line tracings. The time in UT is indicated at each feature location.
Next: 6.4 Outbound Results
Return to dissertation table of contents page.
Return to main
Galileo Table of Contents Page.
Return to Fundamental
Technologies Home Page.
Updated 8/23/19, Cameron Crane
QUICK FACTS
Mission Duration: Galileo was planned to have a mission duration of around 8 years, but was kept in operation for 13 years, 11 months, and 3 days, until it was destroyed in a controlled impact with Jupiter on September 21, 2003.
Destination: Galileo's destination was Jupiter and its moons, which it orbitted for 7 years, 9 months, and 13 days.