


Investigation of the Magnetosphere of Ganymede with Galileo's Energetic Particle Detector
Ph.D. dissertation by Shawn M. Stone, University of Kansas,
1999.
Copyright 1999 by Shawn M. Stone. Used with permission.
6.2.2 Electron Results
In the inbound phase of the encounter the electrons do not show the same type of random absorptions as the ions do. The very first electron signature that appears in all electron channels is a loss cone signature (1st field line connecting to Ganymede) that appears just after the boundary crossing of the inbound phase at 18:49:40. For model M1, an inspection of Figure 6.6 indicates that a signature could be expected around 18:48:11 UT. However, model M1 has poor correspondence of pitch and phase angle with the real data around this time. It was decided to run in force pitch phase mode in order to accurately locate the first loss cone signature predicted by model M1. Figure 6.38 shows the rate profile of the first loss cone predicted by model M1 in the electrons. The time of occurrence is 18:48:25 UT which is 1 minute 15 seconds early (about four spins). The breakdown of the data point indicated in Figure 6.38 by the arrow into a collimator pitch and phase scatter plot is shown in Figure 6.39. This is a loss cone with aLC~=14°. A trace performed on the sublook 1 direction is presented in Figures 6.40 through 6.45 and summarized in Table 6.6. This particle begins its journey in a null region. It seems to translate for a few gyroperiods then is captured and guided towards impact with Ganymede. This can easily be seen by inspecting Figures 6.44 and 6.45.
Table 6.6 Summary of Figures 6.40 through 6.45 for subenergy 74 keV sublook direction 1 for model M1 channel E3.
| Figure | Information | Observation |
| 6.40 | (A) Radius of particle from Ganymede. (B) Z component of particle trajectory. | Particle moves along the field line until impacting Ganymede. |
| 6.41 | (A) X component of particle trajectory. (B) Y component of particle trajectory. | Particle moves along the field line until impacting Ganymede. |
| 6.42 | (A) Magnetic field sampled by the particle. (B) Magnetic moment sampled by the particle | The value of the magnetic field for this trajectory is near zero at t = 0 s. Value of magnetic moment fluctuates until the magnetic field reaches 70 nT. |
| 6.43 | (A) Speed of the particle. (B) Pitch angle of the particle. | The speed of the particle is constant through the entire trajectory. The pitch angle shows the particle moves nearly parallel along the entire trajectory. |
| 6.44 | ZX projection of the trajectory of the particle. | The trajectory along the first field line connecting to Ganymede. |
| 6.45 | ZY projection of the trajectory of the particle. | The trajectory along the first field line connecting to Ganymede. |
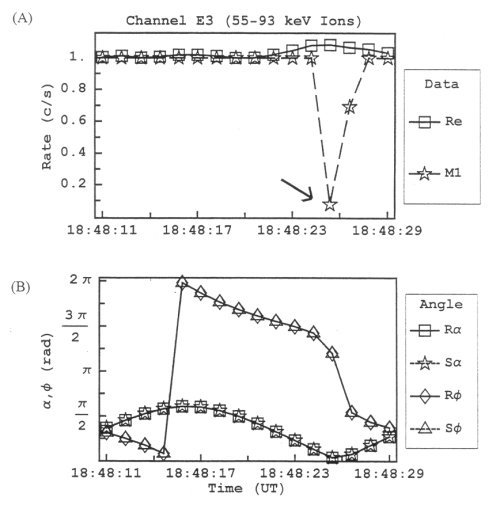 |
Figure 6.38 (A) Rate profile for feature G2-18:48:11 for channel E3 model M1 compared to real data (Re). This feature is run in force pitch phase mode to show that model 1 predicts the magnetic field connects to Ganymede at 18:48:25. The normal run mode is shown in Appendix C. (B) The pitch (a) and phase (f) values of the particles as measured by the EPD detector relative to the real R and simulated S field in force pitch phase mode. |
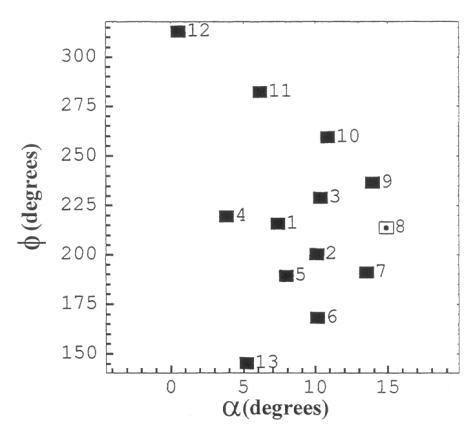 |
Figure 6.39 Collimator pitch and phase scatter plot of the data point indicated in Figure 6.38 for model M1 channel E3 subenergy 74 keV. This can be clearly seen as a loss cone signature due to Ganymede. The loss cone angle is predicted to be about 14° for this model M1 feature. |
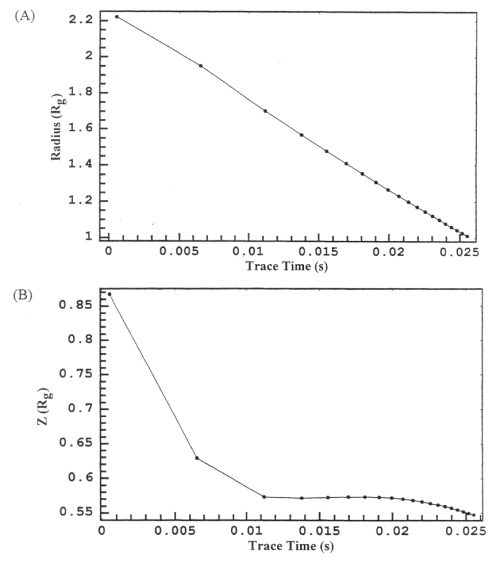 |
Figure 6.40 (A) Length of the radius vector from the center of Ganymede to the particle as a function of trace time in seconds for subenergy 74 keV sublook direction 1 for model M1 channel E3. (B) The Z component of the particle position in GSII coordinates for subenergy 74 keV sublook direction 1 for model M1 channel E3. |
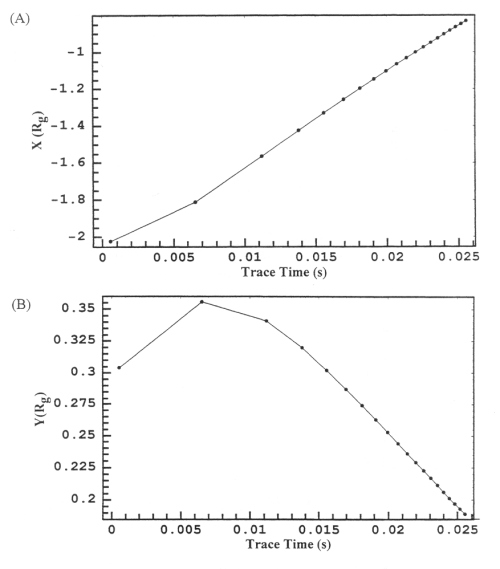 |
Figure 6.41 (A) The X component of the particle position in GSII coordinates for subenergy 74 keV sublook direction 1 for model M1 channel E3. (B) The Z component of the particle position in GSII coordinates for subenergy 74 keV sublook direction 1 for model M1 channel E3. |
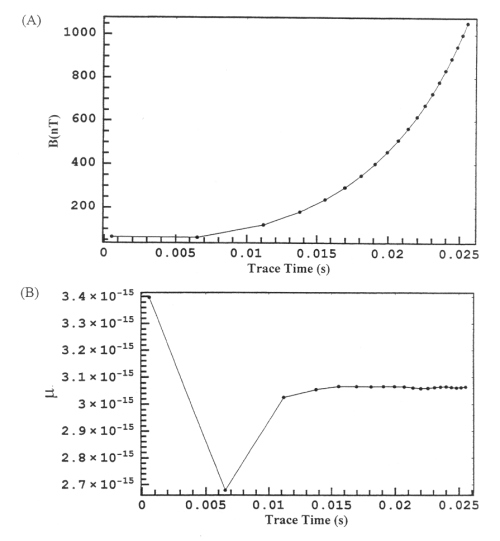 |
Figure 6.42 (A) Magnetic field at the location of the particle as a function of trace time for subenergy 74 keV sublook direction 1 for model M1 channel E3. (B) Magnetic moment at the location of the particle as a function of trace time for subenergy 74 keV sublook direction 1 for model M1 channel E3. |
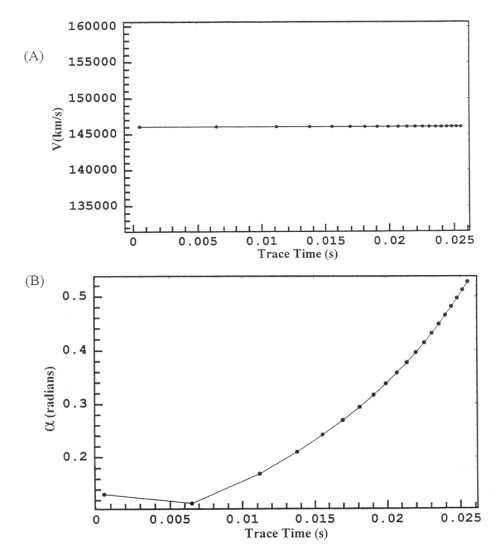 |
Figure 6.43 (A) Velocity of the particle as a function of trace time for subenergy 74 keV sublook direction 1 for model M1 channel E3. (B) Pitch angle of the particle as a function of trace time for subenergy 74 keV sublook direction 1 for model M1 channel E3. |
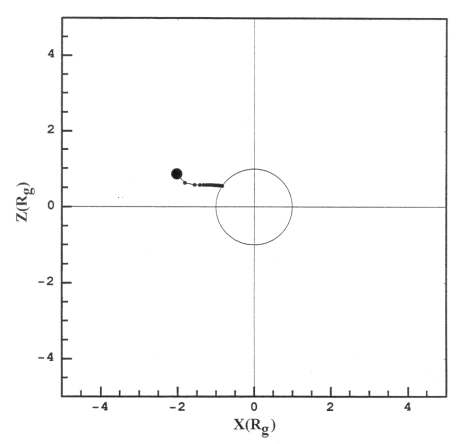 |
Figure 6.44 ZX projection of the trajectory for subenergy 74 keV sublook direction 1 for model M1 channel E3. |
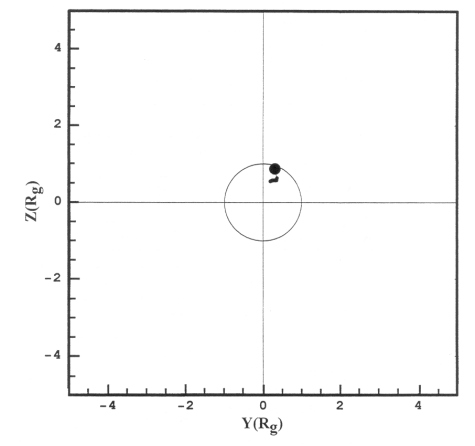 |
Figure 6.45 ZY projection of the trajectory for subenergy 74 keV sublook direction 1 for model M1 channel E3. |
Return to dissertation table of contents page.
Return to main
Galileo Table of Contents Page.
Return to Fundamental
Technologies Home Page.
Updated 8/23/19, Cameron Crane
QUICK FACTS
Mission Duration: Galileo was planned to have a mission duration of around 8 years, but was kept in operation for 13 years, 11 months, and 3 days, until it was destroyed in a controlled impact with Jupiter on September 21, 2003.
Destination: Galileo's destination was Jupiter and its moons, which it orbitted for 7 years, 9 months, and 13 days.