


Investigation of the Magnetosphere of Ganymede with Galileo's Energetic Particle Detector
Ph.D. dissertation by Shawn M. Stone, University of Kansas,
1999.
Copyright 1999 by Shawn M. Stone. Used with permission.
6.2.2 Electron Results (continued)
The story for the tracing of electrons in model M2 is much the same as model M1 during the inbound portion. The first occurrence of a loss cone, however, happens later. Figure 6.46 shows the first predicted loss cone signature for the electrons in model M2 taking place at 18:49:24, which is about 20 s from the actual occurrence of 18:49:43. The arrow in Figure 4.46 indicates the trajectory that is broken down into a pitch and phase scatter plot in Figure 6.47 for channel E3 subenergy 74 keV. Figure 6.47 indicates that the loss cone for this feature is aLC~=19°. Sublook 1 is chosen for a detailed time-reversed tracing, the results of which are shown in Figures 6.48 to 6.53 and summarized in Table 6.7.
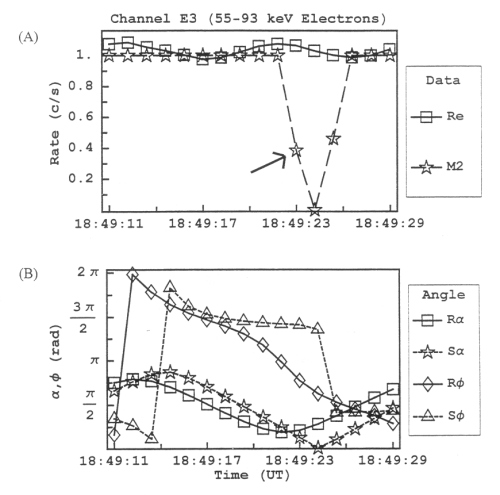 |
Figure 6.46 (A) Rate profile for feature G2-18:49:11 for channel E3 model M2 compared to real data (Re). Model M2 predicts the magnetic field connects to Ganymede at 18:49:24. (B) The pitch (a) and phase (f) values of the particles as measured by the EPD detector relative to the real R and simulated S field. |
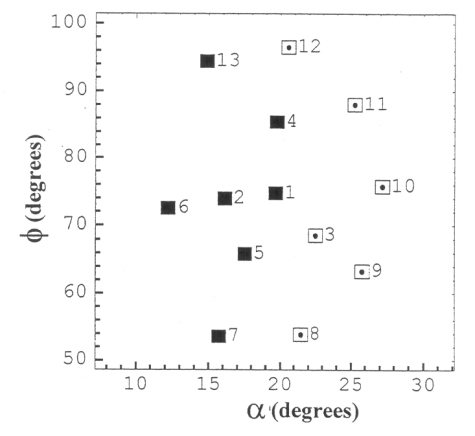 |
Figure 6.47 Collimator pitch and phase scatter plot of the data point indicated in Figure 6.46 for model M2 channel E3 subenergy 74 keV. This can be clearly seen as a loss cone signature due to Ganymede. The loss cone angle is predicted to be about 20° for this model M2 feature. |
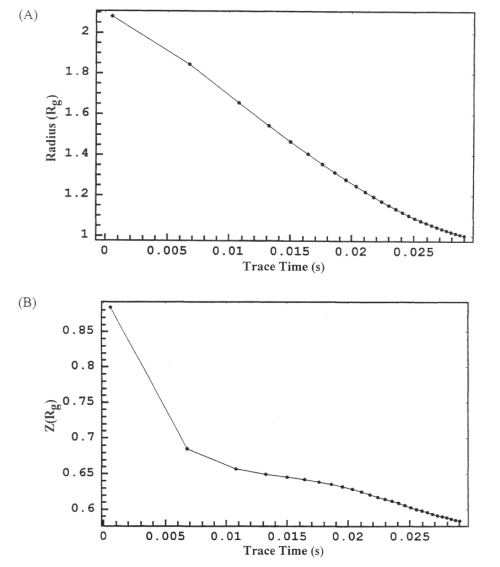 |
Figure 6.48 (A) Length of the radius vector from the center of Ganymede to the particle as a function of trace time in seconds for subenergy 74 keV sublook direction 1 for model M2 channel E3. (B) The Z component of the particle position in GSII coordinates for subenergy 74 keV sublook direction 1 for model M2 channel E3. |
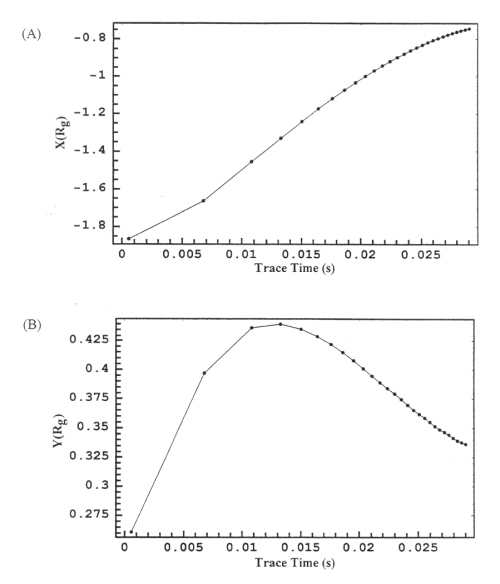 |
Figure 6.49 (A) The X component of the particle position in GSII coordinates for subenergy 74 keV sublook direction 1 for model M2 channel E3. (B) The Y component of the particle position in GSII coordinates for subenergy 74 keV sublook direction 1 for model M2 channel E3. |
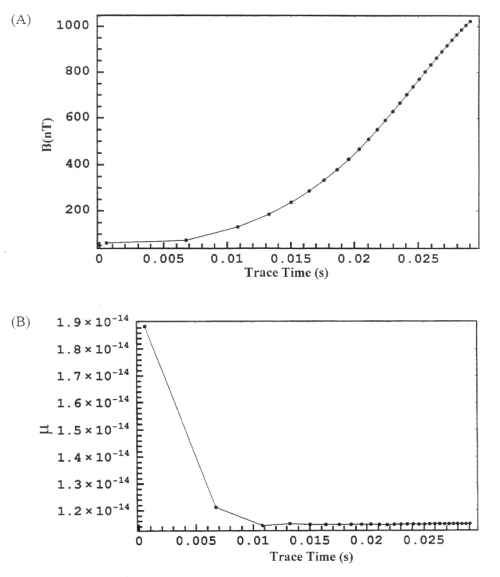 |
Figure 6.50 (A) Magnetic field at the location of the particle as a function of trace time for subenergy 74 keV sublook direction 1 for model M2 channel E3. (B) Magnetic moment at the location of the particle as a function of trace time for subenergy 74 keV sublook direction 1 for model M2 channel E3. |
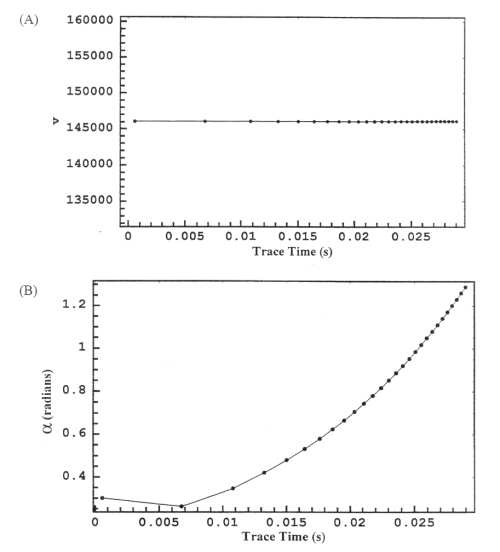 |
Figure 6.51 (A) Velocity of the particle as a function of trace time for subenergy 74 keV sublook direction 1 for model M2 channel E3. (B) Pitch angle of the particle as a function of trace time for subenergy 72 keV sublook direction 1 for model M2 channel E3. |
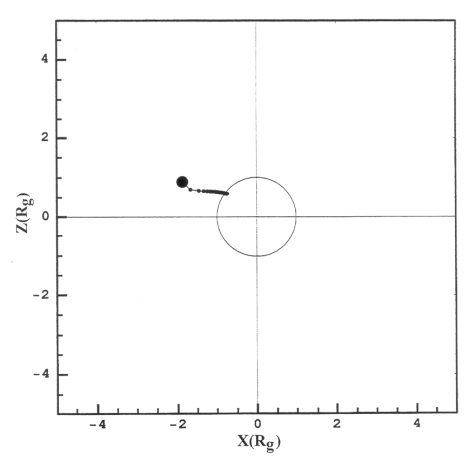 |
Figure 6.52 ZX projection of the trajectory for subenergy 74 keV sublook direction 1 for model M2 channel E3. |
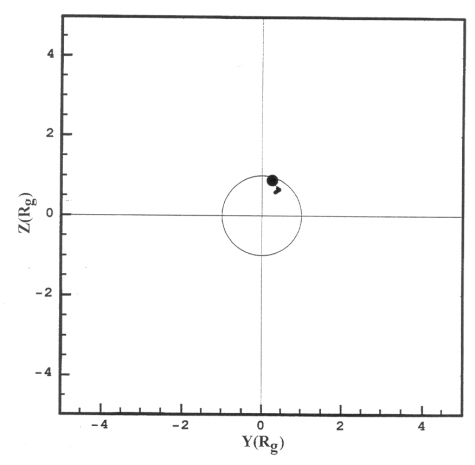 |
Figure 6.53 ZY projection of the trajectory for subenergy 74 keV sublook direction 1 for model M2 channel E3. |
Table 6.7 Summary of Figures 6.48 through 6.53 for subenergy 74 keV sublook direction 1 for model M2 channel E3.
| Figure | Information | Observation |
| 6.48 | (A) Radius of particle from Ganymede. (B) Z component of particle trajectory. | Particle moves along the field line until impacting Ganymede. |
| 6.49 | (A) X component of particle trajectory. (B) Y component of particle trajectory. | Particle moves along the field line until impacting Ganymede |
| 6.50 | (A) Magnetic field sampled by the particle. (B) Magnetic moment sampled by the particle. | The value of the magnetic field for this trajectory is near zero at t=0 s. Value of magnetic moment fluctuates until the magnetic field reaches 70 nT. |
| 6.51 | (A) Speed of the particle. (B) Pitch angle of the particle. | The speed of the particle is constant through the entire trajectory. The pitch angle shows the particle moves nearly parallel along the entire trajectory. |
| 6.52 | ZX projection of the trajectory of the particle. | The trajectory along the first field line connecting to Ganymede. |
| 6.53 | ZY projection of the trajectory of the particle. | The trajectory along the first field line connecting to Ganymede. |
Next: 6.3 Closest Approach Results
Return to dissertation table of contents page.
Return to main
Galileo Table of Contents Page.
Return to Fundamental
Technologies Home Page.
Updated 8/23/19, Cameron Crane
QUICK FACTS
Mission Duration: Galileo was planned to have a mission duration of around 8 years, but was kept in operation for 13 years, 11 months, and 3 days, until it was destroyed in a controlled impact with Jupiter on September 21, 2003.
Destination: Galileo's destination was Jupiter and its moons, which it orbitted for 7 years, 9 months, and 13 days.