


Investigation of the Magnetosphere of Ganymede with Galileo's Energetic Particle Detector
Ph.D. dissertation by Shawn M. Stone, University of Kansas,
1999.
Copyright 1999 by Shawn M. Stone. Used with permission.
7.1 Feature G2-18:56:31, the Addition of Corotational Electric Field (continued)
M2 Results:
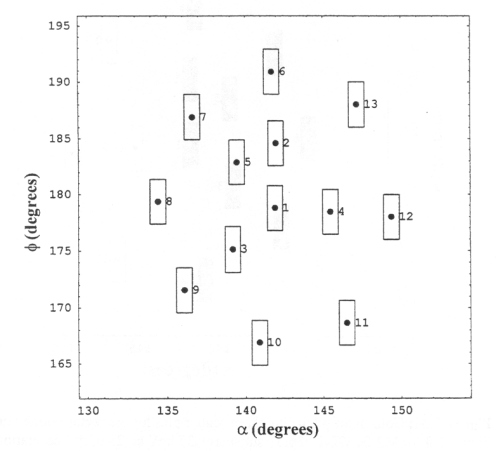 |
Figure 7.30 Collimator pitch and phase scatter plot for the sector pointed out in Figure 7.9 for M2 E1 G2-18:56:31 subenergy 37 keV at .25 of full corotation. The angles are in degrees. The filled in squares represent trajectories that intersected the surface of Ganymede and were absorbed. Open squares are trajectories that missed. |
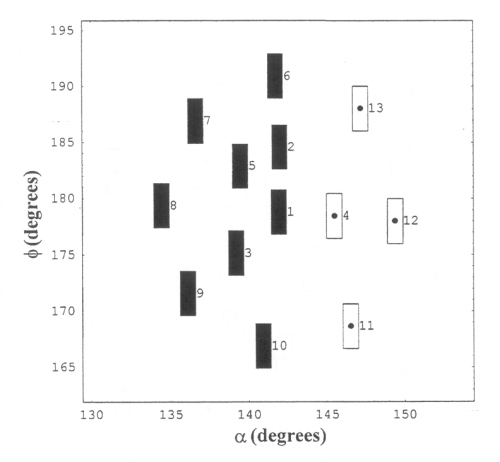 |
Figure 7.31 Collimator pitch and phase scatter plot for the sector pointed out in Figure 7.9 for M2 E1 G2-18:56:31 subenergy 37 keV at .5 of full corotation. The angles are in degrees. The filled in squares represent trajectories that intersected the surface of Ganymede and were absorbed. Open squares are trajectories that missed. |
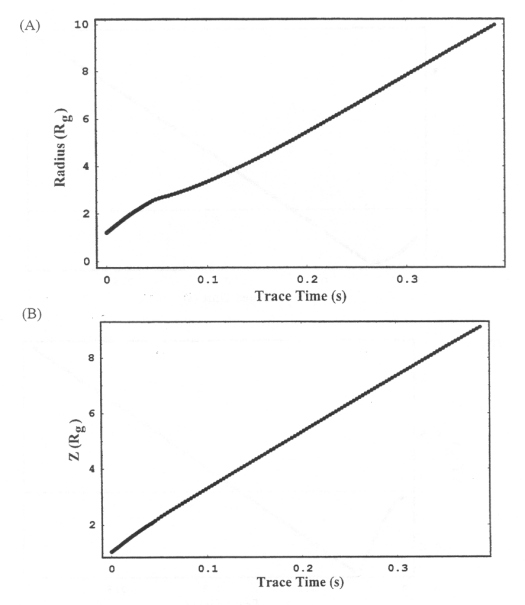 |
Figure 7.32 25% of full corotation. (A) Length of the radius vector from the center of Ganymede to the particle as a function of trace time in seconds for subenergy 37 keV sublook direction 1 for model M2 channel E1. (B) The Z component of the particle position in GSII coordinates for subenergy 37 keV sublook direction 1 for model M2 channel E1. |
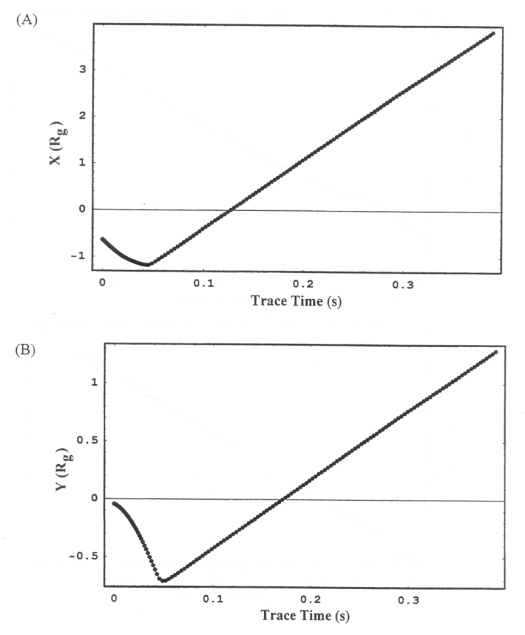 |
Figure 7.33 25% of full corotation. (A) The X component of the particle position in GSII coordinates for subenergy 37 keV sublook direction 1 for model M2 channel E1. (B) The Z component of the particle position in GSII coordinates for subenergy 37 keV sublook direction 1 for model M2 channel E1. |
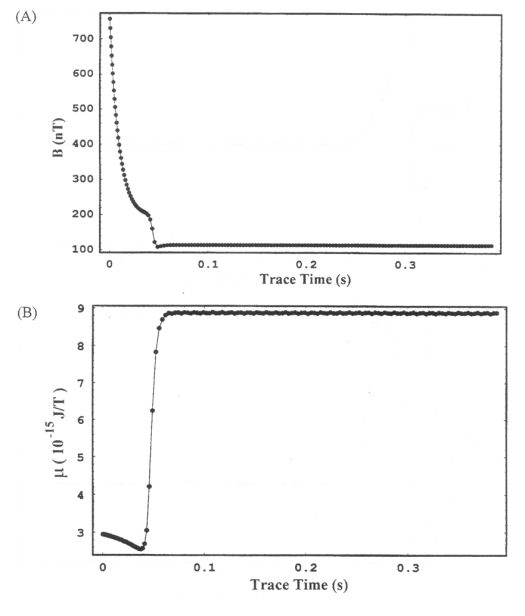 |
Figure 7.34 25% of full corotation. (A) Magnetic field at the location of the particle as a function of trace time for subenergy 37 keV sublook direction 1 for model M2 channel E1. (B) Magnetic moment at the location of the particle as a function of trace time for subenergy 37 keV sublook direction 1 for model M2 channel E1. |
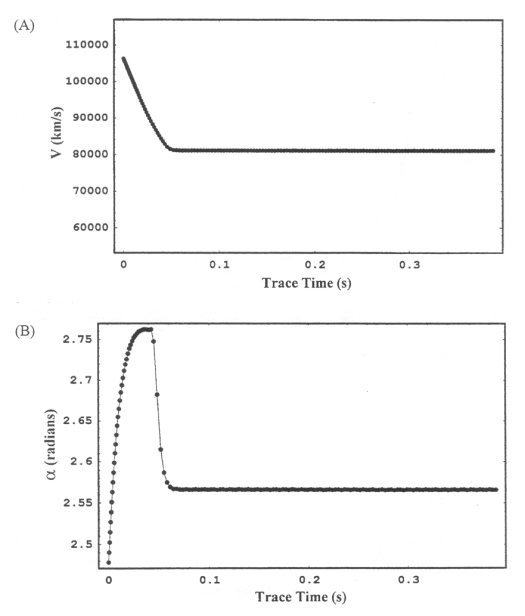 |
Figure 7.35 25% of full corotation. (A) Velocity of the particle as a function of trace time for subenergy 37 keV sublook direction 1 for model M2 channel E1. (B) Pitch angle of the particle as a function of trace time for subenergy 37 keV sublook direction 1 for model M2 channel E1. |
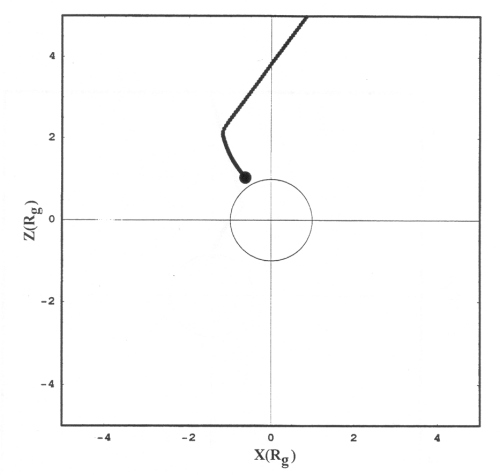 |
Figure 7.36 ZX projection of the trajectory for subenergy 37 keV sublook direction 1 for model M2 channel E1. |
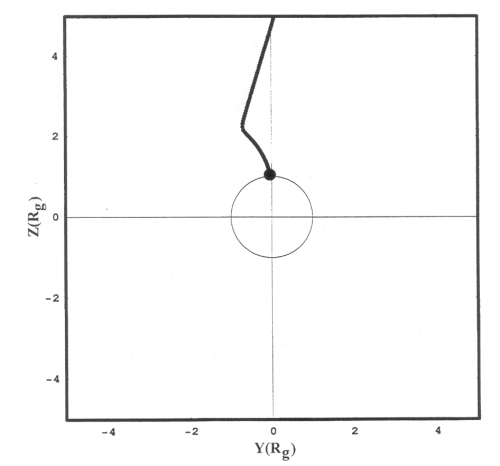 |
Figure 7.37 ZY projection of the trajectory for subenergy 37 keV sublook direction 1 for model M2 channel E1. |
Table 7.5 Summary of the time-reversed particle trace presented in Figures 7.32 through 7.37 for subenergy 37 keV sublook direction 1 for model M2 channel E1 at 25% of full corotation.
| Figure | Information | Observation |
| 7.32 | (A) Radius of particle from Ganymede. (B) Z component of particle trajectory. | The E1 electron makes it out of the magnetosphere of Ganymede. |
| 7.33 | (A) X component of particle trajectory. (B) Y component of particle trajectory. | The E1 electron makes it out of the magnetosphere of Ganymede. |
| 7.34 | (A) Magnetic field sampled by the particle. (B) Magnetic moment sampled by the particle. | The magnetic field shows the transition from within the magnetosphere of Ganymede to the Jovian background field. The magnetic moment is conserved throughout the trajectory. |
| 7.35 | (A) Speed of the particle as it moves through its trajectory. (B) Pitch angle of the particle. | While in the Ganymede magnetosphere, the 25% of full corotation electric field decreases the energy of the E1 electrons until they make it out of the region. The pitch angle becomes near anti-field aligned. |
| 7.36 | ZX projection of the trajectory of the particle. | The electron is shown following the magnetic field line very closely. It makes it out of the magnetosphere of Ganymede. |
| 7.37 | ZY projection of the trajectory of the particle. | The electron is shown following the magnetic field line very closely. It makes it out of the magnetosphere of Ganymede. |
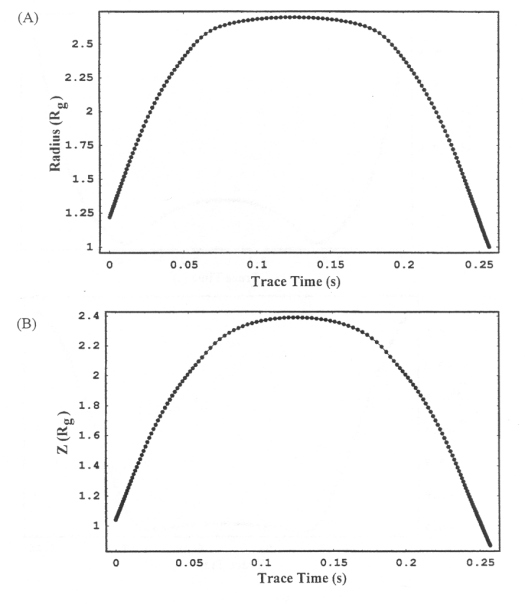 |
Figure 7.38 50% of full corotation. (A) Length of the radius vector from the center of Ganymede to the particle as a function of trace time in seconds for subenergy 37 keV sublook direction 1 for model M2 channel E1. (B) The Z component of the particle position in GSII coordinates for subenergy 37 keV sublook direction 1 for model M2 channel E1. |
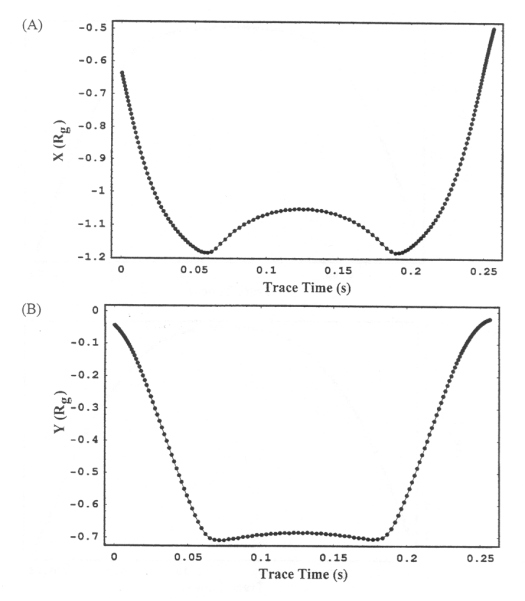 |
Figure 7.39 50% of full corotation. (A) The X component of the particle position in GSII coordinates for subenergy 37 keV sublook direction 1 for model M2 channel E1. (B) The Z component of the particle position in GSII coordinates for subenergy 37 keV sublook direction 1 for model M2 channel E1. |
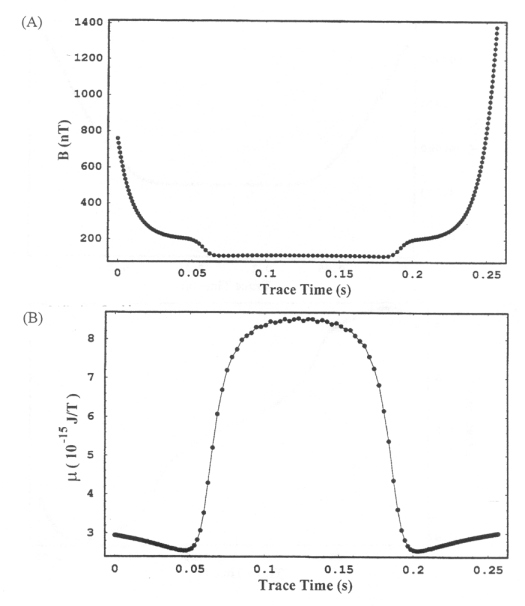 |
Figure 7.40 50% of full corotation. (A) Magnetic field at the location of the particle as a function of trace time for subenergy 37 keV sublook direction 1 for model M2 channel E1. (B) Magnetic moment at the location of the particle as a function of trace time for subenergy 37 keV sublook direction 1 for model M2 channel E1. |
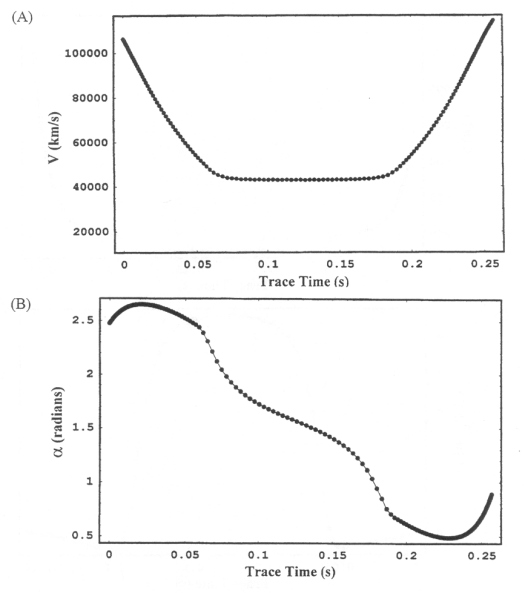 |
Figure 7.41 50% of full corotation. (A) Velocity of the particle as a function of trace time for subenergy 37 keV sublook direction 1 for model M2 channel E1. (B) Pitch angle of the particle as a function of trace time for subenergy 37 keV sublook direction 1 for model M2 channel E1. |
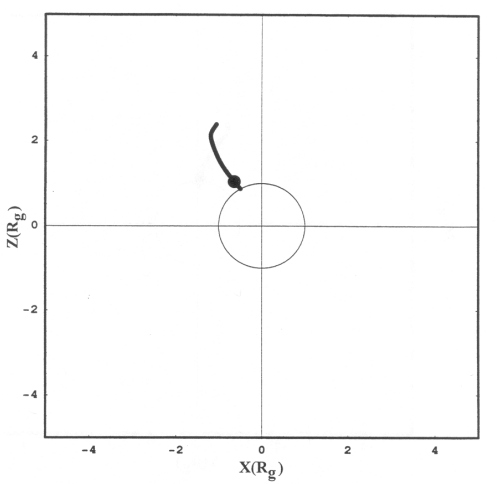 |
Figure 7.42 ZX projection of the trajectory for subenergy 37 keV sublook direction 1 for model M2 channel E1 at 50% of full corotation. |
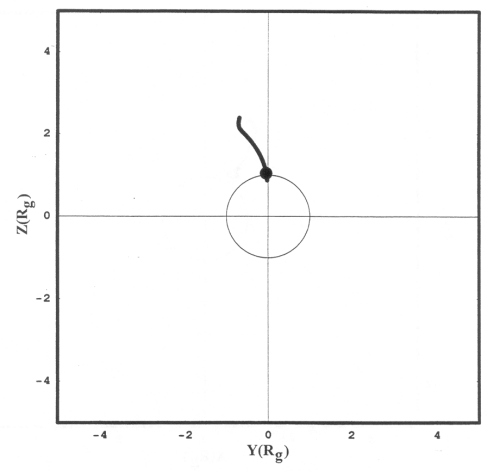 |
Figure 7.43 ZY projection of the trajectory for subenergy 37 keV sublook direction 1 for model M2 channel E1 at 50% of full corotation. |
Table 7.6 Summary of the time-reversed particle trace presented in Figures 7.38 through 7.43 for subenergy 37 keV sublook direction 1 for model M2 channel E1 at 50% of full corotation.
| Figure | Information | Observation |
| 7.38 | (A) Radius of particle from Ganymede. (B) Z component of particle trajectory. | The E1 electron is reflected back to impact the surface of Ganymede. |
| 7.39 | (A) X component of particle trajectory. (B) Y component of particle trajectory. | The E1 electron is reflected back to impact the surface of Ganymede. |
| 7.40 | (A) Magnetic field sampled by the particle. (B) Magnetic moment sampled by the particle. | The E1 electron is reflected back to impact the surface of Ganymede. The maximum magnetic field sampled by the electron is 1400 nT. The magnetic moment remains constant. |
| 7.41 | (A) Speed of the particle as it moves through its trajectory. (B) Pitch angle of the particle. | The speed of the electron is reduced until it reaches its electrostatic mirror point. It is then accelerated along the magnetic field towards Ganymede. |
| 7.42 | ZX projection of the trajectory of the particle. | The electron is shown following the magnetic field line very closely. It reaches an electrostatic mirror point and is reflected towards Ganymede. |
| 7.43 | ZY projection of the trajectory of the particle. | The electron is shown following the magnetic field line very closely. It reaches an electrostatic mirror point and is reflected towards Ganymede. |
Next: 7.2 Feature G2-19:10:51, the Addition of Parallel Electric Field
Return to dissertation table of contents page.
Return to main
Galileo Table of Contents Page.
Return to Fundamental
Technologies Home Page.
Updated 8/23/19, Cameron Crane
QUICK FACTS
Mission Duration: Galileo was planned to have a mission duration of around 8 years, but was kept in operation for 13 years, 11 months, and 3 days, until it was destroyed in a controlled impact with Jupiter on September 21, 2003.
Destination: Galileo's destination was Jupiter and its moons, which it orbitted for 7 years, 9 months, and 13 days.