


Investigation of the Magnetosphere of Ganymede with Galileo's Energetic Particle Detector
Ph.D. dissertation by Shawn M. Stone, University of Kansas,
1999.
Copyright 1999 by Shawn M. Stone. Used with permission.
7.2 Feature G2-19:10:51, the Addition of Parallel Electric Field
The physics of parallel electric fields was discussed in Section 2.5.1. During the outbound pass, the shape of the observed electron article signatures is too wide for a plain loss cone. In Chapter 6 scattering of the electrons during a second bounce encounter was shown to bring these features into agreement. Another mechanism that could explain this phenomenon is the presence of an anti-parallel electric field (anti-parallel to the magnetic field). That would bring the mirror point closer to the surface of Ganymede as discussed in Section 2.5.1 and thus widen the absorption signature.
The feature chosen to run with an anti-parallel electric field is G2-19:10:51, for which the scattering results are presented in Figures 6.125 through 6.128 for models M1 and M2. The increments of parallel electric field chosen are 10 mV and 50 mV. The results for model M1 are presented in Figures 7.44 through 7.49 and are summarized in Table 7.7. It can be seen that even 10 mV widens the simulated absorption signature, but it also tends to increase the depth. A value of 50 mV destroys the feature entirely. It is obvious that the addition of parallel electric field beyond 10 mV is ruled out in the simulation for model M1.
 |
Figure 7.44 (A) Rate profile of model M1 energy channel E1 with an anti-parallel electric field of 10 mV. There is already a profound effect at this level of E||. (B) The pitch and phase angles are computed from the look direction of the EPD detector and the appropriate magnetic field vector R for real and S for simulated. |
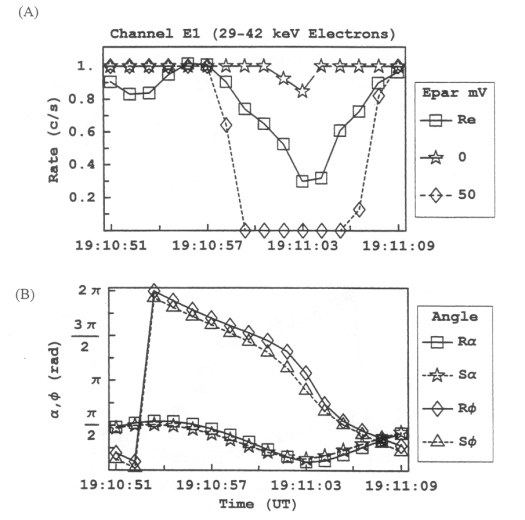 |
Figure 7.45 (A) Rate profile of model M1 energy channel E1 with an anti-parallel electric field of 50 mV. The amount of absorption is much too deep at this level of E||. (B) The pitch and phase angles are computed from the look direction of the EPD detector and the appropriate magnetic field vector R for real and S for simulated. |
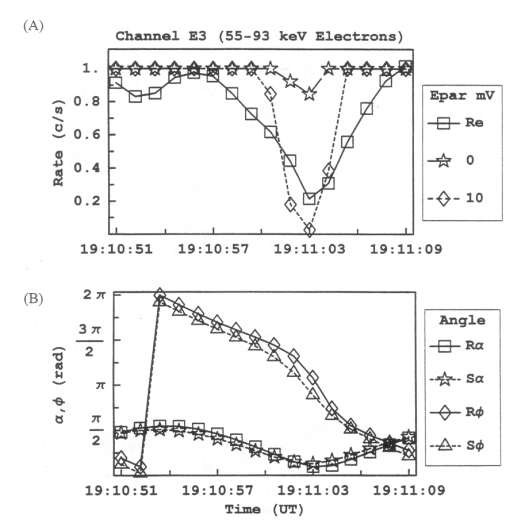 |
Figure 7.46 (A) Rate profile of model M1 energy channel E3 with an anti-parallel electric field of 10 mV. It seems that the feature may begin to match with an increased magnitude. (B) The pitch and phase angles are computed from the look direction of the EPD detector and the appropriate magnetic field vector R for real and S for simulated. |
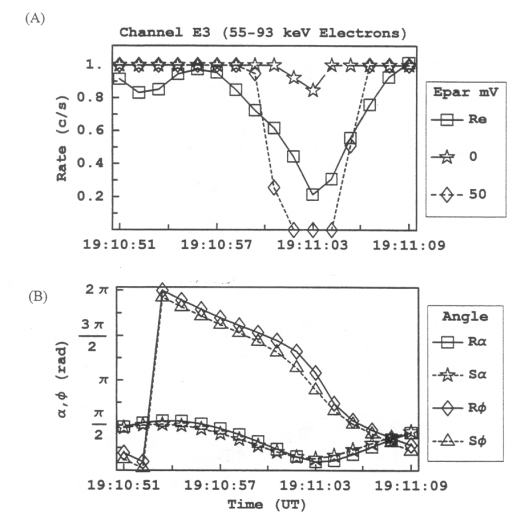 |
Figure 7.47 (A) Rate profile of model M1 energy channel E3 with an anti-parallel electric field of 50 mV. The feature still cannot be matched by E||. (B) The pitch and phase angles are computed from the look direction of the EPD detector and the appropriate magnetic field vector R for real and S for simulated. |
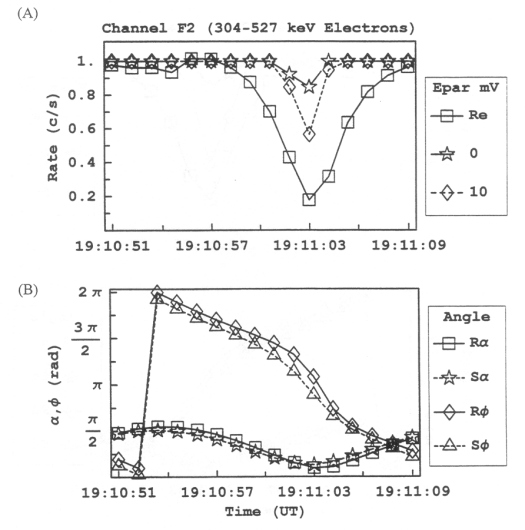 |
Figure 7.48 (A) Rate profile of model M1 energy channel F2 with an anti-parallel electric field of 10 mV. It seems that the feature may begin to match with an increased magnitude. (B) The pitch and phase angles are computed from the look direction of the EPD detector and the appropriate magnetic field vector R for real and S for simulated. |
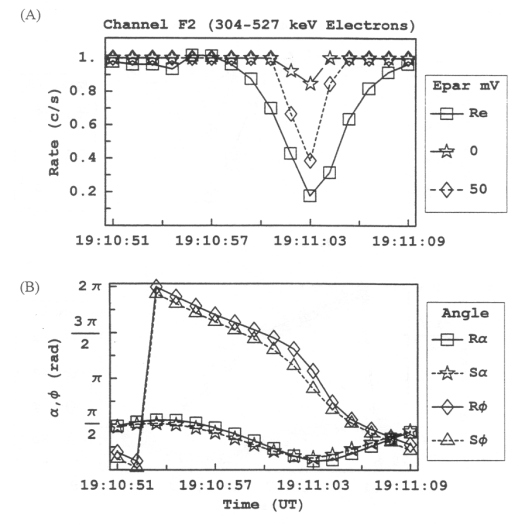 |
Figure 7.49 (A) Rate profile of model M1 energy channel F2 with an anti-parallel electric field of 50 mV. It seems that the F2 energy channel may match with an increased E||. (B) The pitch and phase angles are computed from the look direction of the EPD detector and the appropriate magnetic field vector R for real and S for simulated. |
Table 7.7 Inclusion of anti-parallel electric field for feature G2-19:10:51; summary of Figures 7.44 through 7.49 for model M1.
| Figure | Information | Observations |
| 7.44 | Feature G2-19:10:51. Model M1 energy channel E1 with 10 mV of parallel electric field. | The widening and the deepening of the E1 feature is already pronounced. |
| 7.45 | Feature G2-19:10:51. Model M1 energy channel E1 with 50 mV of parallel electric field. | The widening and the deepening of the E1 feature is more severe than at 10 mV. The simulated feature is destroyed. |
| 7.46 | Feature G2-19:10:51. Model M1 energy channel E3 with 10 mV of parallel electric field. | The widening and the deepening of the E3 feature is already pronounced. |
| 7.47 | Feature G2-19:10:51. Model M1 energy channel E3 with 50 mV of parallel electric field. | The widening and the deepening of the E3 feature is more severe than at 10 mV. The simulated feature is destroyed. |
| 7.48 | Feature G2-19:10:51. Model M1 energy channel F2 with 10 mV of parallel electric field. | The widening and the deepening of the F2 feature is not as pronounced as the lower energy electron channels at 10 mV. |
| 7.49 | Feature G2-19:10:51. Model M1 energy channel F2 with 50 mV of parallel electric field. | The widening and the deepening of the F2 feature is starting to match. The field required to do so is greater than 50 mV. |
The results for model M2 are presented in Figures 7.50 through 7.55 and are summarized in Table 7.8.
Return to dissertation table of contents page.
Return to main
Galileo Table of Contents Page.
Return to Fundamental
Technologies Home Page.
Updated 8/23/19, Cameron Crane
QUICK FACTS
Mission Duration: Galileo was planned to have a mission duration of around 8 years, but was kept in operation for 13 years, 11 months, and 3 days, until it was destroyed in a controlled impact with Jupiter on September 21, 2003.
Destination: Galileo's destination was Jupiter and its moons, which it orbitted for 7 years, 9 months, and 13 days.