Investigation of the Magnetosphere of Ganymede with Galileo's Energetic Particle Detector
Ph.D. dissertation by Shawn M. Stone, University of Kansas,
1999.
Copyright 1999 by Shawn M. Stone. Used with permission.
6.4.1 Feature G2-19:08:51
This feature is strictly an anti-loss cone signature. Figure 6.106 shows the real data for electron channels E1, E3, and F2 normalized to 90º pitch. It shows that the higher the energy of the electron, the deeper the loss cone. First, a run in extended bounce mode is implemented without scattering to judge the size of the hole in the distribution absent scattering. Figures 6.107 through 6.110 show the extended bounce mode results without scattering for model M1 and M2, channels E3 and F2. An inspection of these plots shows that model M1 shows only a slight absorption, yet model M2 predicts a deep hole in the rate profile centered on the real feature. It is clear that with the addition of scattering, model M2 will begin to fill in to match the feature and model M1 will begin to deplete to match.
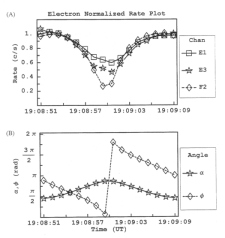 |
Figure 6.106 (A) Rate profile for feature 19:08:51 for the electrons as measured by the EPD instrument during the G2 encounter. An anti-loss cone exists that is partially filled in for low energy electrons (E1 and E3), and near empty for the high energy electrons (F2). (B) The pitch (a) and phase (f) values of the particles as measured by the EPD detector. |
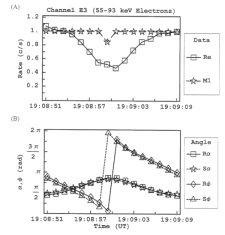 |
Figure 6.107 (A) Simulated M1 and real (Re) rate profile for feature G2-19:08:51 of Channel E3 normalized to 90º of pitch. (B) The pitch and phase angles are computed from the look direction of the EPD detector and the appropriate magnetic field vector R for real and S for simulated. |
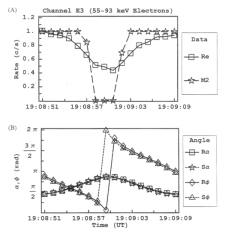 |
Figure 6.108 (A) Simulated M2 and real (Re) rate profile for feature G2-19:08:51 of Channel E3 normalized to 90º of pitch. (B) The pitch and phase angles are computed from the look direction of the EPD detector and the appropriate magnetic field vector R for real and S for simulated. |
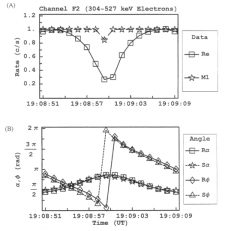 |
Figure 6.109 (A) Simulated M1 and real (Re) rate profile for feature G2-19:08:51 of Channel F2 normalized to 90º of pitch. (B) The pitch and phase angles are computed from the look direction of the EPD detector and the appropriate magnetic field vector R for real and S for simulated. |
 |
Figure 6.110 (A) Simulated M2 and real (Re) rate profile for feature G2-19:08:51 of Channel F2 normalized to 90º of pitch. (B) The pitch and phase angles are computed from the look direction of the EPD detector and the appropriate magnetic field vector R for real and S for simulated. |
The results for extended bounce mode with the addition of scattering are presented in Figures 6.111 through 6.114 for model M1 energy channels E3 and F2. As can be seen, scattering does in fact bring the feature into agreement. However, it is in a non-intuitive sense. Scattering in this case actually helps deplete the loss cone. The loss cone fills in with decreasing scattering coefficient.
 |
Figure 6.111 (A) Simulated M1 and real (Re) rate profile for feature G2-19:08:51 of channel E3 normalized to 90º of pitch. The simulated runs are done in extended bounce mode with scattering included. (B) The pitch (a) and phase (f) values of the particles as measured by the EPD detector. |
 |
Figure 6.112 (A) Simulated M1 and real (Re) rate profile for feature G2-19:08:51 of channel E3 normalized to 90º of pitch. The simulated runs are done in extended bounce mode with scattering included. (B) The pitch (a) and phase (f) values of the particles as measured by the EPD detector. |
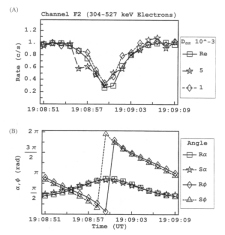 |
Figure 6.113 (A) Simulated M1 and real (Re) rate profile for feature G2-18:56:31 of channel F2 normalized to 90º of pitch. The simulated runs are done in extended bounce mode with scattering included. (B) The pitch and phase angles are computed from the look direction of the EPD detector and the appropriate magnetic field vector R for real and S for simulated. |
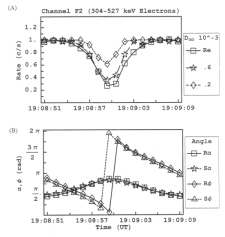 |
Figure 6.114 (A) Simulated M1 and real (Re) rate profile for feature G2-19:08:51 of channel F2 normalized to 90º of pitch. The simulated runs are done in extended bounce mode with scattering included. (B) The pitch and phase angles are computed from the look direction of the EPD detector and the appropriate magnetic field vector R for real and S for simulated. |
Return to dissertation table of contents page.
Return to main
Galileo Table of Contents Page.
Return to Fundamental
Technologies Home Page.
Updated 8/23/19, Cameron Crane
QUICK FACTS
Mission Duration: Galileo was planned to have a mission duration of around 8 years, but was kept in operation for 13 years, 11 months, and 3 days, until it was destroyed in a controlled impact with Jupiter on September 21, 2003.
Destination: Galileo's destination was Jupiter and its moons, which it orbitted for 7 years, 9 months, and 13 days.
