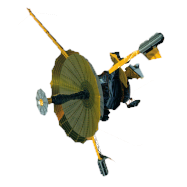
Investigation of the Magnetosphere of Ganymede with Galileo's Energetic Particle Detector
Ph.D. dissertation by Shawn M. Stone, University of Kansas,
1999.
Copyright 1999 by Shawn M. Stone. Used with permission.
8.2 The Ion Null-Point Interactions During the Inbound Pass at G2
As was shown in section 6.2, the ion rate profiles during the inbound pass at G2 from 18:45:00 to 18:52:00 show nips out of the distribution that do not have any dependence on pitch and phase. It was shown that both models were able to predict the presence of these features. A trace through each model showed that the trajectories of the ions were passing through regions of very weak magnetic field. Essentially, the ions were translating into Ganymede. This can be seen in Figures 6.10 through 6.37. Because of their smaller gyroradii, the electrons do not exhibit any null point features.
8.3 Correspondence of the Simulated Loss Cones and Anti-Loss Cones to the Observed Data for the G2 and G7 Encounters
As has been maintained throughout this work, the magnetic field models can be tested by the time-reversed particle following a distribution (in solid angle and energy) of charged particles from the EPD instrument. A charged particle that intersects the surface of Ganymede is removed from the distribution of particles and a simulated rate profile can be constructed, as was presented in Chapter 5. The model that is able to recover the observed absorption signatures is most likely a correct representation of the internal field as well as the external field of Ganymede. Chapter 6 and Appendix B present quite a few examples of loss cones and anti-loss cone features with the magnetic field only for G2 and G7. They are summarized in Tables 8.3 through 8.8.
The first difference that is noticeable between models M1 and M2 is the occurrence of the first electron absorption signature. As was reported in section 6.2.1, the appearance of the first electron loss cone appears a full four spins too early (1 minute 15 seconds) for model M1. Also, the pitch and phase of the simulated data for model M1 are poorly matched. The occurrence of the first electron loss cone appears 20 s early in model M2 and the pitch and phase are matched very well. During closest approach of the G2 encounter, there is no noticeable difference between model M1 and model M2 in the recovery of the absorption features. Everywhere else, however, model M2 consistently is able to do a better job (especially during the G7 encounter). At the regions where model M2 is unable to predict the shape of the feature it is assumed that either scattering or electric field effects are important.
Table 8.3 Closest approach feature G2-18:56:31. The simulated run is performed in one shot mode with magnetic field only.
| Model | Result | Figure |
| M1 | Channel A4 ions recover the loss cone very well. | 6.56 |
| M2 | Channel A4 ions recover the loss cone very well. | 6.57 |
| M1 | Channel E3 electrons recover the loss cone very well. | 6.58 |
| M2 | Channel E3 electrons recover the loss cone very well. | 6.59 |
| M1 | Channel F2 electrons recover the loss cone very well, but miss the observed anti-loss cone feature. | 6.60 |
| M2 | Channel F2 electrons recover the loss cone very well, but miss the observed anti-loss cone feature. | 6.61 |
Table 8.4 Closest approach feature G2-18:58:31. The simulated run is performed in one shot mode with magnetic field only.
| Model | Result | Figure |
| M1 | Channel A4 ions recover the loss cone very well. | 6.85 |
| M2 | Channel A4 ions recover the loss cone very well. | 6.86 |
| M1 | Channel E3 electrons recover the loss cone very well, but miss the observed anti-loss cone feature. | 6.88 |
| M2 | Channel E3 electrons recover the loss cone very well, but miss the observed anti-loss cone feature. | 6.89 |
Table 8.5 Outbound feature G2-19:08:51. The simulated run is performed in extended bounce mode with magnetic field only.
| Model | Result | Figure |
| M1 | Channel E3 electrons place the observed anti-loss cone, but it is matched poorly in depth and shape. | 6.107 |
| M2 | Channel E3 electrons place the observed anti-loss cone which is very deep. | 6.108 |
| M1 | Channel F2 electrons place the observed anti-loss cone, but it is matched poorly in depth and shape. | 6.109 |
| M2 | Channel F2 electrons place the observed anti-loss cone, and the shape and depth are nearly matched. | 1.110 |
Table 8.6 Outbound feature G2-19:10:51. The simulated run is performed in extended bounce mode with magnetic field only.
| Model | Result | Figure |
| M1 | Channel E3 electrons place the observed loss cone, but it is matched poorly in depth and shape. | 6.125 |
| M2 | Channel E3 electrons place the observed loss cone, and the depth is also matched well. The shape of the observed feature is wider than the simulated one. | 6.126 |
| M1 | Channel A4 ions miss the loss cone feature completely. | 6.127 |
| M2 | Channel A4 ions recover the observed ion loss cone in depth and in shape. | 6.128 |
Table 8.7 Inbound feature G7-07:06:33. The simulated run is performed in one shot mode with magnetic field only.
| Model | Result | Figure |
| M1 | Channel E1 electrons place the observed loss cone correctly, but match poorly in depth and shape. | B.10 |
| M1 | Channel E3 electrons place the observed loss cone correctly, but matches poorly in depth and shape. | B.11 |
| M1 | Channel F2 electrons place the observed loss cone correctly, but matches poorly in depth and shape. | B.12 |
| M1 | Channel A2 ions miss the observed loss cone completely. | B.13 |
| M1 | Channel A4 ions miss the observed loss cone completely. | B.14 |
| M1 | Channel A6 ions miss the observed loss cone completely. | B.15 |
| M2 | Channel E1 electrons recover the observed loss cone very well. | B.16 |
| M2 | Channel E3 electrons recover the observed loss cone very well. | B.17 |
| M2 | Channel F2 electrons recover the observed loss cone very well. | B.18 |
| M2 | Channel A2 ions recover the observed loss cone very well. | B.19 |
| M2 | Channel A4 ions recover the observed loss cone very well. | B.20 |
| M2 | Channel A6 ions place the observed loss cone in time, and in shape, but seem to have trouble with the depth. | B.21 |
Table 8.8 Inbound feature G7-07:11:13. The simulated run is performed in one shot mode with magnetic field only.
| Model | Result | Figure |
| M1 | Channel E1 electrons place the observed loss cone correctly, but matches poorly in depth and shape. | B.22 |
| M1 | Channel E3 electrons place the observed loss cone correctly, but matches poorly in depth and shape. | B.23 |
| M1 | Channel F2 electrons place the observed loss cone correctly, but matches poorly in depth and shape. | B.24 |
| M1 | Channel A2 ions place the observed loss cone correctly, but matches poorly in depth and shape. | B.25 |
| M1 | Channel A4 ions place the observed loss cone correctly, but matches poorly in depth and shape. | B.26 |
| M1 | Channel A6 ions miss the observed loss cone completely. | B.27 |
| M2 | Channel E1 electrons recover the observed loss cone very well. | B.28 |
| M2 | Channel E3 electrons recover the observed loss cone very well. | B.29 |
| M2 | Channel F2 electrons recover the observed loss cone very well. | B.30 |
| M2 | Channel A2 ions recover the observed loss cone very well. | B.31 |
| M2 | Channel A4 ions recover the observed loss cone very well. | B.32 |
| M2 | Channel A6 ions place the observed loss cone in time, and in shape, but seems to have trouble with the depth. | B.33 |
Next: 8.4 Pitch Angle Scattering Results for G2 and G7
Return to dissertation table of contents page.
Return to main
Galileo Table of Contents Page.
Return to Fundamental
Technologies Home Page.
Updated 8/23/19, Cameron Crane
QUICK FACTS
Mission Duration: Galileo was planned to have a mission duration of around 8 years, but was kept in operation for 13 years, 11 months, and 3 days, until it was destroyed in a controlled impact with Jupiter on September 21, 2003.
Destination: Galileo's destination was Jupiter and its moons, which it orbitted for 7 years, 9 months, and 13 days.


