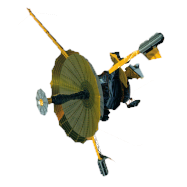
Investigation of the Magnetosphere of Ganymede with Galileo's Energetic Particle Detector
Ph.D. dissertation by Shawn M. Stone, University of Kansas,
1999.
Copyright 1999 by Shawn M. Stone. Used with permission.
8.1 The Model M2 Magnetic Field Model and its Implications for the Plasma Environment Near Ganymede for G2 and G7
Chapter 4 presented the construction of model M2, which is the magnetic field model that includes the external Jupiter background field, an internal multipole field intrinsic to Ganymede, and an external magnetic field contribution from the magnetopause and tail currents in the vicinity of Ganymede. The exact values from the fitting procedure performed are given in Tables 4.7 through 4.9. It can be seen from Figures 4.15 through 4.18 that model M2 is able to fit the Bq and Bf components of the magnetic field better than model M1 for both the G2 and G7 encounters. Tables 8.1 and 8.2 summarize these figures.
Table 8.1 Comparison of magnetic field model M1 and M2 at the G2 encounter.
| Component | Comparison Between M1 and M2 at G2 | Figure |
| Br | The correspondence of both models to the radial component of the observed magnetic field is quite good. Model M2 is able to recover the magnetopause crossing very well. | 4.15a |
| Bq | Model M1 is not as effective as model M2 in matching the theta component. This graph shows very well that the magnetopause and tail field contributions are important and necessary to recover the theta component. | 4.15b |
| Bf | Model M1 is not as effective as model M2 in matching the phi component. This graph shows even more clearly that the magnetopause and tail field contributions are important and necessary to recover the phi component. | 4.16a |
| B | Both models, despite their differences, match the observed magnitude at the G2 encounter. Model M1 displays a null field dip at 18:48:00 that is not observed, but overall is able to match. | 4.16b |
Table 8.2 Comparison of magnetic field model M1 and M2 at the G7 encounter.
| Component | Comparison Between M1 and M2 at G7 | Figure |
| Br | The correspondence of both models to the radial component of the observed magnetic field is quite good. The magnetopause crossing is not very apparent in the radial component of the observed magnetic field. | 4.17a |
| Bq | Model M1 is not as effective as model M2 in matching the theta component. Both models seem to have a bit of trouble near closest approach. | 4.17b |
| Bf | Model M1 is not as effective as model M2 in matching the phi component. This graph shows very clearly that the magnetopause and tail field contributions are important and necessary to recover the phi component. | 4.18a |
| B | Model M2 does very well in recovering the magnitude of the observed magnetic field. Model M1 does fine, but is slightly diminished at closest approach. | 4.18b |
Model M2 is able to fit better between encounters because it assumes that the plasma environment can be different at the G2 encounter (above the plasma sheet) and G7 encounter (below the plasma sheet). For model M2, the internal field model remains the same, but the magnetopause terms are refit at G7 allowing for a different plasma pause. It is then possible to calculate the difference in plasma density between the G2 and G7 encounters. Using the physical parameters given by Neubauer [1998], which at G2 are that ro is 2 Rg , the plasma mass density at G2 is approximately 6x10-19 kg/m3. At G7, with a derived offset of 2.6 Rg, the plasma mass density is 1.17x10⁻¹⁹ kg/m3. This is a factor of 5 difference. At the time of the writing of this dissertation, experimental data for the plasma mass density at the G2 and G7 encounters was not available. Model M2 also predicts (Table 4.10) that the plasma flowing past Ganymede is aberrated from the corotation direction--for G2, 10° about the GSII X axis and -35° about the GSII Z axis; for G7, 30° about the GSII X axis and 40° about the GSII Z axis.
Next: 8.2 The Ion Null-Point Interactions During the Inbound Pass at G2
Return to dissertation table of contents page.
Return to main
Galileo Table of Contents Page.
Return to Fundamental
Technologies Home Page.
Updated 8/23/19, Cameron Crane
QUICK FACTS
Mission Duration: Galileo was planned to have a mission duration of around 8 years, but was kept in operation for 13 years, 11 months, and 3 days, until it was destroyed in a controlled impact with Jupiter on September 21, 2003.
Destination: Galileo's destination was Jupiter and its moons, which it orbitted for 7 years, 9 months, and 13 days.


