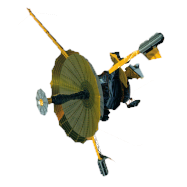
GALILEO
Investigation of the Magnetosphere of Ganymede with Galileo's Energetic Particle Detector
Ph.D. dissertation by Shawn M. Stone, University of Kansas,
1999.
Copyright 1999 by Shawn M. Stone. Used with permission.
List of Tables
- Table 1.1 Planets discovered to have an intrinsic magnetic field by visiting spacecraft
- Table 1.2 Closest approach of the Voyager spacecraft to the Galilean moons
- Table 1.3 Comparison between the times of the observed microsignatures at Saturn for Voyager 1 and 2 and the times predicted by the dipole and Z3+ current models
- Table 1.4 The magnetopause crossing and closest approach times for the G2 and G7 encounters
- Table 3.1 Galileo EPD statistics
- Table 3.2 LEMMS A channels and passband energies
- Table 3.3 LEMMS E and F channels and passband energies
- Table 3.4 LEMMS geometrical factors for A, E, and F channels
- Table 3.5 The standard equatorial coordinates for the north pole of the respective body in J1950
- Table 3.6 The motor position index (0-7) is shown with their corresponding angle q with respect to the SC Z axis
- Table 3.7 Spin sector index (1-16) with their corresponding phase angle f
- Table 4.1 Schmidt quasi-normalized Legendre functions to nmax=3
- Table 4.2 The coefficients aj in the series expansion of the spherical harmonic coefficients Knm(l), of the scalar magnetic potential for the magnetopause field up to nmax=2
- Table 4.3 The coefficients in the series expansion of the spherical harmonics for the tail field Lnm(l) up to nmax=2
- Table 4.4 The Jupiter O6 magnetic field model Schmidt-Normalized spherical harmonic coefficients in Gauss as given by Connerney [1993]
- Table 4.5 The best fit parameters to Equations [4.25] and [4.26] for the three Jovian outbound encounters
- Table 4.6 Values in nT of the uniform Jovian background field used in model 1 calculated from the KK96 model [Khurana, 1997]
- Table 4.7 The mean and standard deviation of the first 100 magnetic field components in GSII Cartesian coordinates
- Table 4.8 Coefficients resulting from the minimization of Equation [4.33] for G2 for r0=2.0 Rg
- Table 4.9 Coefficients for G7 resulting from the minimization of Equation [4.33] with the internal multipole model of Ganymede specified from Table 4.8
- Table 4.10 The boundary parameters for G2 and G7 derived from the fit of Equation [4.35]
- Table 4.11 Aberration angles of the corotational plasma flow as ascertained from the look directions of the maximum and minimum rates
- Table 5.1 The Rm values in Rg beyond which particles in extended bound mode are considered to have convected past the Ganymede interaction region
- Table 5.2 Bounce times between the Ganymede region and the Jupiter bounce point for electrons
- Table 6.1 Summary of the time reversed particle trace presented in Figures 6.12 through 6.17 for subenergy 400 keV sublook direction 1 for model M1 channel A4
- Table 6.2 Summary of Figures 6.18 through 6.23 for subenergy 400 keV sublook direction 5 for model M1 channel A4
- Table 6.3 Summary of Figures 6.26 through 6.31 for subenergy 1110 keV sublook direction 5 for model M2 channel A6
- Table 6.4 Summary of Figures 6.32 through 6.37 for subenergy 1110 keV sublook direction 7 for model M2 channel A6
- Table 6.5 Summary of features of model M1 and M2 not included in the main body of the text. The corresponding graphs are presented in Appendix C.
- Table 6.6 Summary of Figures 6.40 through 6.45 for subenergy 74 keV sublook direction 1 for model M1 channel E3
- Table 6.7 Summary of Figures 6.48 through 6.53 for subenergy 74 keV sublook direction 1 for model M2 channel E3
- Table 6.8 Summary of the time-reversed particle trace presented in Figures 6.70 through 6.75 for subenergy 74 keV sublook direction 3 for model M1 channel E3. (This table still under construction.)
- Table 6.9 Summary of the time-reversed particle trace presented in Figures 6.77 through 6.82 for subenergy 74 keV sublook direction 3 for model M2 channel E3. (This table still under construction.)
- Table 6.10 Summary of features of model M1 and M2 not included in the main body of the text for the closest approach portion of the G2 encounter.
- Table 6.11 Summary of the time-reversed particle trace presented in Figures 6.130 through 6.135 for subenergy 400 keV sublook direction 9 for model M1 channel A4
- Table 6.12 Summary of the time-reversed particle trace presented in Figures 6.137 through 6.142 for subenergy 400 keV sublook direction 10 for model M2 channel A4
- Table 6.13 Summary of features of model M1 and M2 not included in the main body of the text for the outbound portion of the G2 encounter. The corresponding graph is presented in Appendix C.
- Table 7.1 Addition of corotational electric field. Summary of Figures 7.1 through 7.6 for model M1
- Table 7.2 Addition of corotational electric field. Summary of Figures 7.7 through 7.12 for model M2
- Table 7.3 Summary of the time-reversed particle trace presented in Figures 7.15 through 7.20 for subenergy 37 keV sublook direction 1 for model M1 channel E1 at 25% of full corotation
- Table 7.4 Summary of the time-reversed particle trace presented in Figures 7.23 through 7.28 for subenergy 37 keV sublook direction 1 for model M1 channel E1 at 50% of full corotation
- Table 7.5 Summary of the time-reversed particle trace presented in Figures 7.32 through 7.37 for subenergy 37 keV sublook direction 1 for model M2 channel E1 at 25% of full corotation
- Table 7.6 Summary of the time-reversed particle trace presented in Figures 7.38 through 7.43 for subenergy 37 keV sublook direction 1 for model M2 channel E1 at 50% of full corotation
- Table 7.7 Inclusion of anti-parallel electric field for feature G2-19:10:51; summary of Figures 7.44 through 7.49 for model M1
- Table 7.8 Inclusion of anti-parallel electric field for feature G2-19:10:51: summary of Figures 7.50 through 7.55 for model M2
- Table 8.1 Comparison of magnetic field model M1 and M2 at the G2 encounter
- Table 8.2 Comparison of magnetic field model M1 and M2 at the G7 encounter
- Table 8.3 Closest approach feature G2-18:56:31
- Table 8.4 Closest approach feature G2-18:58:31
- Table 8.5 Outbound feature G2-19:08:51
- Table 8.6 Outbound feature G2-19:10:51
- Table 8.7 Inbound feature G7-07:06:33
- Table 8.8 Inbound feature G7-07:11:13
- Table 8.9 Closest approach feature G2-18:56:31
- Table 8.10 Closest approach feature G2-18:58:31
- Table 8.11 Outbound feature G2-19:08:51
- Table 8.12 Outbound feature G2-19:10:51
- Table 8.13 Outbound feature G7-07:22:14
- Table 8.14 Scattering coefficients for the G2 and G7 loss cone and anti-loss cone features derived from the correlations in chapter 6
- Table 8.15 Outbound feature G2-18:56:31
- Table 8.16 Outbound feature G2-19:10:51
Return to dissertation table of contents page.
Return to main
Galileo Table of Contents Page.
Return to Fundamental
Technologies Home Page.
Updated 8/23/19, Cameron Crane
QUICK FACTS
Manufacturer: The Galileo Spacecraft
was manufactured by the Jet Propulsion Laboratory,
Messerschmitt-Bölkow-Blohm, General Electric, and the
Hughes Aircraft Company.
Mission Duration: Galileo was planned to have a mission duration of around 8 years, but was kept in operation for 13 years, 11 months, and 3 days, until it was destroyed in a controlled impact with Jupiter on September 21, 2003.
Destination: Galileo's destination was Jupiter and its moons, which it orbitted for 7 years, 9 months, and 13 days.


